
Page 258 - 《高原气象》2023年第1期
P. 258
高 原 气 象 42 卷
254
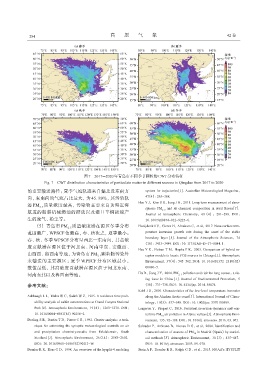
图7 2017 -2020年青岛市不同季节颗粒物CWT分布特征
Fig. 7 CWT distribution characteristics of particulate matter in different seasons in Qingdao from 2017 to 2020
的重要输送路径; 夏季气流轨迹来自偏北及东南方 system for trajectories[J]. Australian Meteorological Magazine,
向, 东南向的气流占比最大, 为 45. 89%, 其污染轨 47(4): 295-308.
Han Y J, Kim S R, Jung J H, 2011. Long-term measurement of atmo‐
迹 PM 质量浓度最高, 污染物主要来自黄海近海
2. 5
spheric PM and its chemical composition in rural Korea[J].
2. 5
航道的船舶机械燃油的排放以及港口车辆运输产
Journal of Atmospheric Chemistry, 68(4): 281-298. DOI:
生的废气、 粉尘等。 10. 1007/s10874-012-9225-6.
(5) 青岛市 PM 质量浓度潜在源区冬季分布 Hooijdonk I V, Clercx H, Abraham C, et al, 2017. Near-surface tem‐
2. 5
范围最广, WPSCF值最高, 春、 秋次之, 夏季最小。 perature inversion growth rate during the onset of the stable
boundary layer[J]. Journal of the Atmospheric Sciences, 74
春、 秋、 冬季 WPSCF分布呈西北—东南向, 其高浓
(10): 3433-3449. DOI: 10. 1175/JAS-D-17-0084. 1.
度贡献潜在源区位于河北南、 河南中东、 安徽西、
Hsu Y K, Holsen T M, Hopke P K, 2003. Comparison of hybrid re‐
山西西、 鲁西南等地, 为青岛市PM 颗粒物污染外 ceptor models to locate PCB sources in Chicago[J]. Atmospheric
2. 5
来输送的主要源区; 夏季 WPSCF 分布区域最小, Environment, 37(4): 545-562. DOI: 10. 1016/S1352-2310(02)
数值最低, 其高浓度贡献潜在源区位于河北东南、 00886-5.
河南东北以及鲁西南等地。 Hu D, Jiang J Y, 2014. PM pollution and risk for lung cancer: a ris‐
2. 5
ing issue in China[J]. Journal of Environmental Protection, 5
参考文献: (30): 731-738. DOI: 10. 4236/jep. 2014. 58074.
Kahl J D, 2010. Characteristics of the low-level temperature inversion
Ashbaugh L L, Malm W C, Sadeh W Z, 1985. A residence time prob‐ along the Alaskan Arctic coast[J]. International Journal of Clima‐
ability analysis of sulfur concentrations at Grand Canyon National tology, 10(5): 537-548. DOI: 10. 1002/joc. 3370100509.
Park[J]. Atmospheric Environment, 19(8): 1263-1270. DOI: Largeron Y, Staquet C, 2016. Persistent inversion dynamics and win‐
10. 1016/0004-6981(85) 90256-2. tertime PM air pollution in Alpine valleys[J]. Atmospheric Envi‐
10
Dorling S R, Davies T D, Pierce C E, 1992. Cluster analysis: a tech‐ ronment, 135: 92-108. DOI: 10. 1016/j. atmosenv. 2016. 03. 045.
nique for estimating the synoptic meteorological controls on air Salvador P, Artinano B, Alonso D G, et al, 2004. Identification and
and precipitation chemistry-results from Eskdalemuir, South characterization of sources of PM in Madrid (Spain) by statisti‐
10
Scotland[J]. Atmospheric Environment, 26(14): 2583-2602. cal methods[J]. Atmospheric Environment, 38(3): 435-447.
DOI: 10. 1016/0960-1686(92)90111-W. DOI: 10. 1016/j. atmosenv. 2003. 09. 070.
Draxler R R, Hess G D, 1998. An overview of the hysplit-4 modeling Stein A F, Draxler R R, Rolph G D, et al, 2015. NOAA's HYSPLIT