Page 39 - 《高原气象》2022年第6期
P. 39

高     原      气     象                                 41 卷
              1402


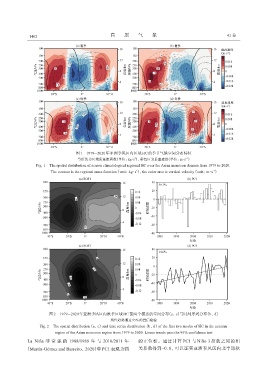
                                   图1   1979-2020年亚洲季风区内区域HC的季节气候空间分布特征
                                                              2
                                                                                     -1
                                    等值线为区域质量流函数(单位:kg∙s ),彩色区为垂直速度(单位:m·s )
                 Fig. 1  The spatial distribution of season climatological regional HC over the Asian monsoon domain from 1979 to 2020.
                                                               2
                                                                                                  -1
                        The contour is the regional mass function(unit:kg∙s),the color area is vertical velocity(unit:m·s )


                       图2   1979-2020年亚洲季风区内秋季区域HC前两个模态的空间分布(a,c)与时间序列分布(b,d)
                                                   线性趋势通过95%的置信检验
                   Fig. 2  The spatial distribution(a,c)and time series distribution(b,d)of the first two modes of HC in the autumn
                          region of the Asian monsoon region from 1979 to 2020. Linear trends pass the 95% confidence test

             La Niña 非 常 强 的 1988/1989 年 与 2010/2011 年          的正位相。通过计算 PC1 与 Niño 3 指数之间的相
             (Martín-Gómez and Barreiro,2020)中PC1表现为强           关系数得到-0. 8,可以证实亚洲季风区内北半球秋
   34   35   36   37   38   39   40   41   42   43   44