Page 247 - 《高原气象》2022年第6期
P. 247

高     原      气     象                                 41 卷
              1610


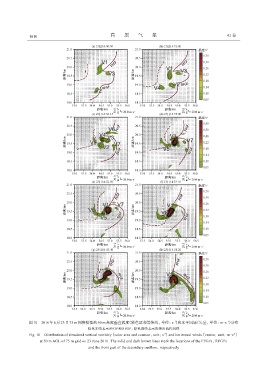
              图10   2016年6月23日75 m网格模拟的50 m高度垂直涡度(彩色区和等值线,单位:s )和水平风场(矢量,单位:m·s )分布
                                                                                -1
                                                                                                        -1
                                         棕色实线表示FFGF和RFGF,棕色虚线表示次级出流阵风锋
                                                                           -1
                                                                                                           -1
              Fig. 10  Distribution of simulated vertical vorticity(color area and contour,unit:s )and horizontal winds(vector,unit:m·s )
                   at 50 m AGL of 75 m grid on 23 June 2016. The solid and dash brown lines mark the locations of the FFGFs,RFGFs
                                         and the front gust of the secondary outflow,respectively
   242   243   244   245   246   247   248   249   250   251   252