
Page 259 - 《高原气象》2022年第5期
P. 259
高 原 气 象 41 卷
1352
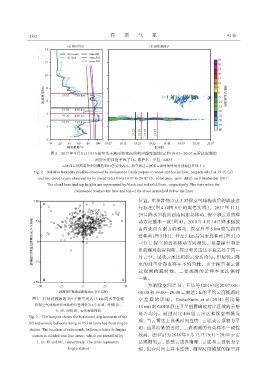
图2 2017年9月8日19:15探空基于液面和冰面的相对湿度廓线(a)和19:07-20:07云雷达探测的
两层云的反射率因子(b,彩色区,单位:dBZ)
云底和云顶高度分别用黑色和红色实线表示,探空到达云底或云顶时的时间分别标注在线下方
Fig. 2 Relative humidity profiles observed by radiosonde(with respect to water and ice surface,respectively)at 19:15(a)
and two cloud layers observed by by cloud radar from 19:07 to 20:07(b,color area,unit:dBZ)on 8 September 2017.
The cloud base and top heights are represented by black and red solid lines,respectively. The time when the
radiosonde reaches the base and top of the cloud is marked below the lines
位置,在多普勒雷达上对探空气球施放后的轨迹进
行标注(图 4 和图 5 中的黑色实线)。2017 年 11 月
29日降水回波由西南向东北移动,探空和云系的移
动方向基本一致(图 4)。2018年 4月 14日降水回波
由西北向东南方向移动,探空升至 5 km 前先向西
北移动[图 5(b)],升至 5 km 后向东北移动[图 5(c)
~(f)],探空和云系移动方向相反。根据探空和云
系的相对位置判断,探空和云雷达不总是处于同一
片云中。层状云虽比积状云分布均匀,但层状云降
水的时空分布也存在不均匀性。由于探空和云雷
达观测的瞬时性,二者观测的云样本无法保持
一致。
为消除空间差异,王喆等(2016)选取 07:00-
08:00 和 19:00-20:00 云雷达 1 h 的平均云高抵消时
图3 泾河站施放的399个探空到达15 km的水平位移 空 差 异 的 影 响 。 Costa-Surós et al(2014)利 用 每
将探空气球相对泾河站的位置划分为4个区域,分别用Ⅰ、 15 min的 GOES静止卫星图像确定对比区域的云层
Ⅱ、Ⅲ、Ⅳ标识,××代表泾河站
是否均匀。通过对比 406 组云雷达和探空图像发
Fig. 3 The boxplot shows the horizontal displacement of the
现,当云雷达上出现时间连续、云底或云顶较为平
399 radiosonde balloons rising to 15 km launched from Jinghe
坦、边界清晰的云时,二者观测的云高样本一致性
station. The location of radiosonde balloon relative to Jinghe
station is divided into four areas,which are identified by 较高。图 6(a)为 2018年 1月 12日 19:11-20:01云雷
I,II,III and IV,respectively. The cross represents 达观测的云,虽然云边界清晰,云底和云顶较为平
Jinghe station 坦,但在时间上并不连续,相应时段施放的探空并