
Page 249 - 《高原气象》2022年第5期
P. 249
高 原 气 象 41 卷
1342
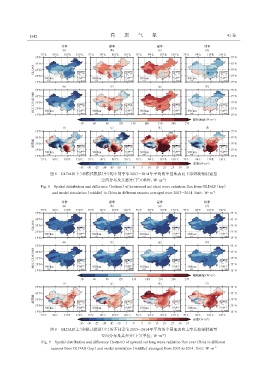
图8 GLDAS(上)和模式模拟(中)的不同季节2003-2014年平均的中国地表向下净短波辐射通量
空间分布及其差异(下)(单位:W·m )
-2
Fig. 8 Spatial distribution and difference(bottom)of downward net short wave radiation flux from GLDAS(top)
and model simulation(middle)in China in different seasons averaged over 2003-2014. Unit:W·m -2
图9 GLDAS(上)和模式模拟(中)的不同季节2003-2014年平均的中国地表向上净长波辐射通量
空间分布及其差异(下)(单位:W·m )
-2
Fig. 9 Spatial distribution and difference(bottom)of upward net long wave radiation flux over China in different
seasons from GLDAS(top)and model simulation(middle)averaged from 2003 to 2014. Unit:W·m -2