
Page 229 - 《高原气象》2022年第5期
P. 229
高 原 气 象 41 卷
1322
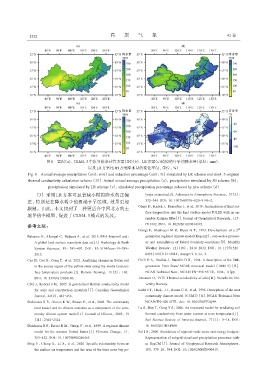
图8 实况(a)、CLM4. 5中原导热率计算方案(JH)(b)、LR方案(c)模拟的年平均降水量(单位:mm)、
以及LR方案比JH方案降水量的变化率(d,单位:%)
Fig. 8 Annual average precipitation(unit:mm)and reduction percentage(unit:%)simulated by LR scheme and clm4. 5 original
thermal conductivity calculation scheme(JH). Actual annual average precipitation(a),precipitation simulated by JH scheme(b),
precipitation simulated by LR scheme(c),simulated precipitation percentage reduced by new scheme(d)
(3) 采用 LR 方案可显著减小模拟降水的正偏 lynya antarctica[J]. Advances in Atmospheric Sciences,37(5):
差,特别是在降水稀少的极端干旱区域,效果更加 532-544. DOI:10. 1007/s00376-020-9146-2.
Ghent D,Kaduk J,Remedios J,et al,2010. Assimilation of land sur‐
限制。由此,本文找到了一种更适合中国北方的土
face temperature into the land surface model JULES with an en‐
壤导热率模型,促进了CLM4. 5模式的发展。
semble Kalman filter[J]. Journal of Geophysical Research,115:
参考文献: D19112. DOI:10. 1029/2010JD014392.
Giorgi F,Marinucci M R,Bates G T,1993. Development of a 2 nd
Balsamo G,Albergel C,Beljaars A,et al,2015. ERA-Interim/Land: generation regional climate model(Regcm2):convective process‐
A global land surface reanalysis data set[J]. Hydrology & Earth es and assimilation of lateral boundary-conditions[J]. Monthly
System Sciences,19:389-407. DOI:10. 5194/hess-19-389- Weather Review,121(10):2814-2832. DOI:10. 1175/1520-
2015. 0493(1993)121<2814:doasgr>2. 0. co;2.
Cao H,Gao B,Gong T,et al,2021. Analyzing changes in frozen soil Grell G A,Dudhia J,Stauffer D R,1994. A description of the fifth-
in the source region of the yellow river using the modis land sur‐ generation Penn State/ NCAR mesoscal model( MM 5)[R].
face temperature products[J]. Remote Sensing,13(2):180. NCAR Technical Note,NCAR/ TN-398 +S TR,1994,117pp
DOI:10. 3390/rs13020180. Johansen O,1975. Thermal conductivity of soils[D]. Trondheim Uni‐
Côté J,Konrad J M,2005. A generalized thermal conductivity model versity Norway.
for soils and construction materials[J]. Canadian Geotechnical Kiehl J T,Hack,J J,Bonan G B,et al,1996. Description of the ncar
Journal,42(2):443-458. community climate model(CCM3)[R]. NCAR Technical Note
Dickinson R E,Oleson K W,Bonan G,et al,2005. The community NCAR/TN-420+STR,doi:10. 5065/D6FF3Q99.
land model and its climate statistics as a component of the com‐ Lu S,Ren T,Gong Y S,2006. An improved model for predicting soil
munity climate system model[J]. Journal of Climate,2005,19 thermal conductivity from water content at room temperature[J].
(11):2302-2324. Soil Science Society of America Journal,71(1):8-14. DOI:
Dickinson R E,Errico R M,Giorgi F,et al,1989. A regional climate 10. 5065/D6TB14WH
model for the western United States[J]. Climatic Change,15, Pal J S,2000. Simulation of regional-scale water and energy budgets:
383-422. DOI:10. 1007/BF00240465. Representation of subgrid cloud and precipitation processes with‐
Ding Y,Cheng X,Li X,et al,2020. Specific relationship between in RegCM[J]. Journal of Geophysical Research Atmospheres,
the surface air temperature and the area of the terra nova bay po‐ 105,579-29,594. DOI:10. 1029/2000JD900415.