
Page 228 - 《高原气象》2022年第5期
P. 228
5 期 任余龙等:三种土壤导热率模型对中国北方地表温度的模拟 1321
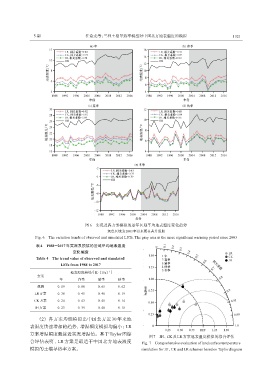
图6 实况及各方案模拟的逐年区域平均地表温度变化趋势
灰色区域为2003年以来更显著升温期
Fig. 6 The variation trends of observed and simulated LSTs. The gray area is the more significant warming period since 2003
表4 1988--2017年实况及模拟的区域平均地表温度
变化幅度
Table 4 The trend value of observed and simulated
LSTs from 1988 to 2017
-1
地表温度趋势/[K·(10a) ]
方案
年 春季 夏季 秋季
观测 0. 89 0. 88 0. 65 0. 62
LR方案 0. 30 0. 45 0. 48 0. 19
CK方案 0. 24 0. 43 0. 41 0. 14
JH方案 0. 23 0. 39 0. 40 0. 18
(2) 各方案均能模拟出中国北方近 30 年来地
表温度快速增加的趋势,增温幅度模拟均偏小;LR
方案增温幅度最接近实况增温值。基于 Taylor图综
图7 JH、CK及LR方案地表温度模拟的综合评估
合评估表明,LR 方案是最适于中国北方地表温度 Fig. 7 Comprehensive evaluation of land surface temperature
模拟的土壤导热率方案。 simulation for JH,CK and LR schemes based on Taylor diagram