


Page 201 - 《爆炸与冲击》2026年第10期
P. 201
第 46 卷             李军润,等: 基于开源信息融合的公共安全爆炸事故分析方法                                第 10 期

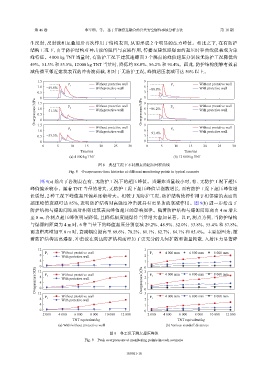
               生反射,反射波相互叠加后再次作用于结构表面,从而形成                           2  个明显的压力峰值。相比之下,在有防护
               结构工况下,由于防护结构对冲击波的阻挡与衰减作用,传播至建筑迎爆面的超压时程曲线仅表现为单
               峰特征。4 000 kg TNT    当量时,有防护工况下建筑迎爆面               3  个测点的峰值超压分别较无防护工况降低约
               49%、51.3%  和  53.5%,12 000 kg TNT  当量时,降低约    88.8%、86.2%  和  91.4%。因此,防护结构能够有效衰
               减传播至邻近建筑表面的冲击波荷载,相对于无防护工况,峰值超压衰减可达                                  50%  以上。

                  1.5                      Without protctive wall  9                      Without protctive wall

                  1.0  −49.0%  P 1         With protctive wall   6  −88.8%   P 1          With protctive wall
                  0.5                                            3
                   0                                             9
                 Overpressure/MPa  1.0 0  −51.3%  P 2  Without protctive wall  Overpressure/MPa 0 6 −86.2%  P 2  Without protctive wall
                  1.5
                                                                                          With protctive wall
                                           With protctive wall
                                                                 3
                  0.5
                                                                 0
                  1.5
                  1.0          P 3         Without protctive wall  9 6  −91.4%  P 3       Without protctive wall
                                           With protctive wall
                                                                                          With protctive wall
                  0.5  −53.5%                                    3
                   0                                             0
                    0     5     10     15    20     25    30      0     5     10     15    20     25    30
                                     Time/ms                                       Time/ms
                                (a) 4 000 kg TNT                              (b) 12 000 kg TNT
                                             图 8    典型工况下不同测点的超压时程曲线
                                Fig. 8    Overpressure-time histories at different monitoring points in typical scenario

                   图  9(a) 给出了各测点在有、无防护工况下的超压峰值。当爆炸当量较小时,有、无防护工况下超压
               峰值偏差较小。随着          TNT  当量的增大,无防护工况下超压峰值呈指数增长,而有防护工况下超压峰值增
               长缓慢,2   种工况下峰值超压偏差逐渐增大。相较于无防护工况,防护结构使得作用于相邻建筑表面的
               超压峰值衰减可达         85%,表明防护结构对高强度冲击波具有更显著的衰减作用。图                             9(b) 进一步给出了
               防护结构与爆源间距离对相邻建筑表面峰值超压的影响规律。随着防护结构与爆源间距离由                                            4 m  增大
               至  8 m,各测点超压峰值明显降低,且降低幅度随爆炸当量增大愈加显著。以                                P 测点为例,当防护结构
                                                                                     3
               与爆源间距离为        4 m  时,6  种当量下的峰值超压分别衰减            29.2%、48.9%、52.0%、53.8%、55.4%    和  57.8%,
               而当距离增加至       8 m  时,衰减幅度提高至        69.6%、78.2%、81.1%、82.7%、84.1%   和  85.4%。主要原因为:随
               着防护结构远离爆源,冲击波在到达防护结构前经历了更充分的几何扩散和能量耗散,入射压力显著降
                  12        Without protctive wall               3

                   8  P 1   With protctive wall                  2  P 1   4 000 mm   6 000 mm   8 000 mm
                   4                                             1
                   0                                             0 3
                 Overpressure/MPa  8 4 0  P 2  Without protctive wall  Overpressure/MPa  2 1 0  P 2  4 000 mm  6 000 mm  8 000 mm
                  12
                            With protctive wall


                  12
                   8  P 3   Without protctive wall               3 2  P 3  4 000 mm  6 000 mm   8 000 mm
                            With protctive wall
                   4                                             1
                   0                                             0
                    2 000  4 000  6 000  8 000  10 000  12 000     2 000  4 000  6 000  8 000  10 000  12 000
                                 TNT equivalent/kg                              TNT equivalent/kg
                           (a) With/without protective wall                (b) Various standoff distances

                                                  图 9    各工况下测点超压峰值
                                       Fig. 9    Peak overpressure at monitoring points in each scenario


                                                         105901-10

