Page 53 - 《爆炸与冲击》2026年第4期
P. 53

第 46 卷               马    龙,等: 触地爆下建筑表面冲击波载荷的分布规律                               第 4 期

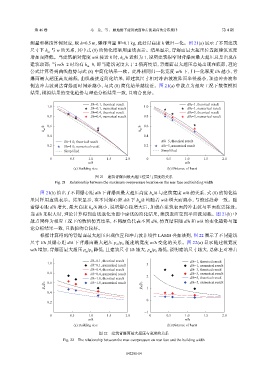
               测量和模拟算例对应,取           h=0.5 m,爆炸当量    W=0.1 kg,此处以高度      h  做归一化。图     21(a) 展示了不同建筑
               尺寸下   h 与  w  的关系,其中式      (8) 的简化结果用虚线表示。结果显示,背爆面最大超压位置随建筑宽度
                      m
               增加而降低。当建筑相对宽度              w/h  接近  0  时,h /h  近似为  1,说明建筑很窄时背爆面最大超压总是出现在
                                                       m
               建筑顶部;当     w/h=2  时均有   h =0,即当建筑宽度大于         2  倍高度后,背爆面最大超压总是出现在底部,理论
                                        m
               公式计算得到曲线趋势与式             (8) 中简化结果一致。此外相同归一化宽度                  w/h  下,归一化厚度      l/h  越小,背
               爆面最大超压高度越低,曲线越接近简化结果,即建筑尺寸相对冲击波波阵面半径越小,顶边冲击波和
               侧边冲击波到达背爆面时间差越小,与式                   (8) 简化结果越接近。图         21(a) 中散点为相应工况下数值模拟
               结果,模拟结果的变化趋势与理论分析结果一致,且吻合良好。

                      1.0                l/h=0.1, theorical result  1.0             d/h=1, theorical result
                                         l/h=0.1, numerical result                  d/h=1, numerical result
                                         l/h=0.4, theorical result                  d/h=3, theorical result
                      0.8                l/h=0.4, numerical result  0.8             d/h=3, numerical result
                      0.6                                        0.6
                     h m /h                                     h m /h
                      0.4                                        0.4
                             l/h=1.0, theorical result                   d/h=5, theorical result
                      0.2    l/h=1.0, numerical result           0.2     d/h=5, numerical result
                             Simplified                                  Simplified
                       0        0.5     1.0      1.5     2.0      0        0.5     1.0     1.5      2.0
                                        w/h                                        w/h
                                  (a) Building size                        (b) Distance of burst
                                           图 21    建筑背爆面最大超压位置与宽度的关系
                         Fig. 21    Relationship between the maximum overpressure location on the rear face and building width

                   图  21(b) 给出了不同爆心距       d/h  下背爆面最大超压高度         h /h  与建筑宽度    w/h  的关系,式   (8) 的简化结
                                                                    m
               果同样用虚线表示。结果显示,在不同爆心距                     d/h  下  h /h  均随着  w/h  增大而减小,与前述趋势一致。随
                                                               m
               着爆心距    d/h  增大,最大高度      h /h  减小,说明爆心距增大后,加载在建筑表面的冲击波与平面波更接近。
                                          m
               当  d/h  无限大时,理论计算得到曲线退化为图中虚线的简化结果,建筑表面受到平面波加载。图                                      21(b) 中
               散点同样为相应工况下的数值仿真结果,不同颜色代表不同                           d/h,仿真结果随      d/h  和  w/h  的变化趋势与理
               论分析结果一致,且数值吻合较好。
                   根据计算得到的背爆面最大超压出现位置和冲击波非线性                           LAMB   叠加法则,图     22  展示了不同建筑
               尺寸  l/h  及爆心距   d/h  下背爆面最大超压        p /p 随建筑宽度      w/h  变化的关系。图       22(a) 显示随建筑宽度
                                                       0
                                                     m
               w/h  增加,背爆面最大超压        p /p 降低,且建筑尺寸        l/h  越大,p /p 越低,说明建筑尺寸越大,总体上对冲击
                                                                      0
                                          0
                                       m                            m
                                         l/h=0.1, theorical result
                      1.0                l/h=0.1, numerical result  3                d/h=1, theorical result
                                                                                     d/h=1, numerical result
                                         l/h=0.4, theorical result                   d/h=3, theorical result
                      0.8                l/h=0.4, numerical result                   d/h=3, numerical result
                                         l/h=1.0, theorical result  2                d/h=5, theorical result
                     p m /p 0  0.6       l/h=1.0, numerical result  p m /p 0  1      d/h=5, numerical result
                      0.4
                                                                  0
                      0.2

                                                                 −1
                       0        0.5     1.0      1.5     2.0       0       0.5     1.0     1.5      2.0
                                        w/h                                        w/h
                                  (a) Building size                        (b) Distance of burst

                                             图 22    建筑背爆面最大超压与宽度的关系
                             Fig. 22    The relationship between the max overpressure on rear face and the building width


                                                         042201-14
   48   49   50   51   52   53   54   55   56   57   58