
Page 120 - 《爆炸与冲击》2026年第3期
P. 120
第 46 卷 许梦飞,等: 循环冲击下高温层理砂岩的动力学特性及损伤模型 第 3 期
3.4 本构模型验证分析
为验证本次试验模型的正确性,根据试验结果,可以得到不同温度下岩石模型参数 m(T)、k(T) 和常
温下 m 、k 与温度的关系,结合式 (5) 可以得到不同温度下 A(T) 和 B(T) 的值,如表 5 所示。A(T) 和
0
0
B(T) 的温度关系拟合曲线的函数表达式分别为:
−6
−9
3
2
2
A(T) = −5.936 41×10 T +8.089 62×10 T −0.001 43T +1.030 27 R = 0.988 75 (19)
2
4
−5
3
2
−8
B(T) = −1.318 16×10 −11 T +3.693 98×10 T −3.331 28×10 T +0.009 71T −0.779 18 R = 0.994 31 (20)
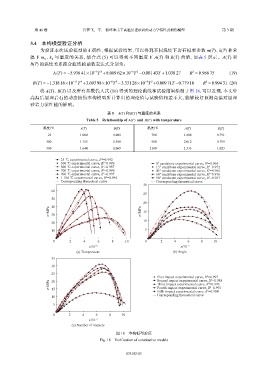
将 A(T)、B(T) 以及所有参数代入式 (16) 得到的理论曲线和试验结果绘制于图 18,可以发现,本文中
高温后层理岩石的动态损伤本构模型所计算出的理论值与试验值相差不大,能够较好预测高温对层理
砂岩力学性能的影响。
B(T) 与温度的关系
表 5 A(T) 和
B(T) with temperature
Table 5 Relationship of A(T) and
温度/℃ A(T) B(T) 温度/℃ A(T) B(T)
25 1.000 1.000 700 1.888 0.791
300 1.155 1.598 900 2.012 0.799
500 1.644 1.069 1 100 1.333 1.023
25 ℃ experimental curve, R =0.992
2
300 ℃ experimental curve, R =0.989 0° sandstone experimental curve, R =0.964
2
2
500 ℃ experimental curve, R =0.987 15° sandstone experimental curve, R =0.972
2
2
700 ℃ experimental curve, R =0.990 45° sandstone experimental curve, R =0.984
2
2
900 ℃ experimental curve, R =0.997 60° sandstone experimental curve, R =0.976
2
2
1 100 ℃ experimental curve, R =0.994 90° sandstone experimental curve, R =0.987
2
2
Corresponding theoretical curve Corresponding theoretical curve
30
60
25
50
20
40
σ/MPa 30 σ/MPa 15
10
20
10 5
0 2 4 6 8 10 0 2 4 6 8 10
ε/10 −3 ε/10 −3
(a) Temperature (b) Angle
35
30
25
First impact experimental curve, R =0.997
2
Second impact experimental curve, R =0.988
2
σ/MPa 20 Third impact experimental curve, R =0.993
2
Fourth impact experimental curve, R =0.993
2
15
Fifth impact experimental curve, R =0.984
2
10 Corresponding theoretical curve
5
0 2 4 6 8 10
ε/10 −3
(c) Number of impacts
图 18 本构模型验证
Fig. 18 Verification of constitutive models
033102-15