Page 177 - 《爆炸与冲击》2026年第01期
P. 177

第 46 卷          伍俊英,等: 金属桥箔电爆炸驱动飞片过程流场瞬态观测与数值模拟                                 第 1 期

                      3                                  3

                                                  Voltage          2.0
                      2                           Current  2
                                                                   1.5
                                                         1
                    Voltage/kV  0                        0  Current/kA  Power/MW  1.0
                      1

                                                                   0.5
                     −1                                  −1
                                                                    0
                     −2                                  −2
                          0       2      4      6       8               0       2      4      6       8
                                     Time/μs                                       Time/μs
                              (a) Voltage and current curves                  (b) Power curve

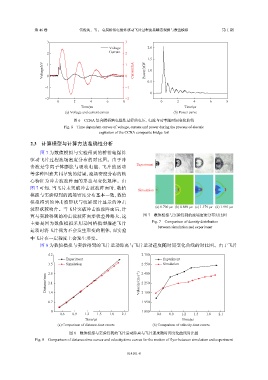
                                  图 6    CCNA  复合膜桥箔电爆炸过程的电压、电流与功率随时间变化曲线
                             Fig. 6    Time dependent curves of voltage, current and power during the process of electric
                                             explosion of the CCNA composite bridge foil

                2.3    计算模型与计算方法准确性分析

                   图  7  为数值模拟与实验得到的桥箔电爆炸
               驱动飞片过程流场密度分布的对比图。由于冲
                                                              Experiment
               击波是等离子体膨胀与吸收电能、飞片的运动
               等多种因素共同导致的结果,流场密度分布的核
               心特征为冲击波波阵面的形态与变化规律。由
               图  7  可知,当飞片未突破冲击波波阵面时,数值                      Simulation
               模拟与实验得到的流场密度分布基本一致,数值
               模拟得到的冲击波形状与纹影照片显示的冲击
                                                                      (a) 0.700 μs  (b) 0.869 μs  (c) 1.379 μs  (d) 1.991 μs
               波形状较吻合。当飞片突破冲击波波阵面后,计
               算与实验得到的冲击波波阵面形状差异略大,这                             图 7    数值模拟与实验得到的流场密度分布对比图
               主要是因为数值模拟采用动网格模型描述飞片                                  Fig. 7    Comparison of density distribution
                                                                       between simulation and experiment
               运动时将飞片视为不会发生形变的刚体,而实验
               中飞片在一定程度上会发生形变。
                   图  8  为数值模拟与实验得到的飞片运动距离与飞片运动速度随时间变化曲线的对比图。由于飞片

                      4.2                                       2 700

                               Experiment                                 Experiment
                      3.5      Simulation                       2 550     Simulation
                      2.8                                       2 400
                     Distance/mm  2.1                          Velocity/(m·s −1 )  2 250


                      1.4
                                                                2 100
                      0.7                                       1 950

                        0                                       1 800
                            0.6  0.9   1.2  1.5   1.8  2.1             0.6  0.9   1.2  1.5   1.8  2.1
                                       Time/μs                                    Time/μs
                           (a) Comparison of distance-time curves    (b) Comparison of velocity-time curves

                                图 8    数值模拟与实验得到的飞片运动距离与飞片速度随时间变化曲线对比图
                 Fig. 8    Comparison of distance-time curves and velocity-time curves for the motion of flyer between simulation and experiment


                                                         014101-8
   172   173   174   175   176   177   178   179   180   181   182