
Page 140 - 《爆炸与冲击》2026年第01期
P. 140
第 46 卷 李军润,等: RC箱型结构内爆炸载荷特性和动力行为分析 第 1 期
Wall 1 600 mm Wall 2 600 mm Slab
1 400 mm DP 5 DP 1 DP 2 1 150 mm
2 000 mm 1 000 mm P 2
1 000 mm
500 mm 500 mm
Wall 3 Wall 4 600 mm 760 mm
1 400 mm DP 3 DP 4 P 1 2 000 mm
500 mm 500 mm 900 mm Overpressure transducers
Displacement transducers
2 000 mm 2 000 mm
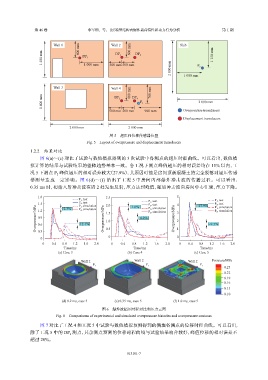
图 5 超压和位移传感器位置
Fig. 5 Layout of overpressure and displacement transducers
1.2.2 结果对比
图 6(a)~(c) 对比了试验与数值模拟得到的 3 次试验中各测点的超压时程曲线。可以看出,数值模
拟计算的结果与试验结果的整体趋势基本一致。各工况下测点峰值超压的相对误差均在 15% 以内,工
况 5 下测点 P 峰值超压的相对误差较大(27.9%),其原因可能是房间顶板混凝土的完全脱落对超压传感
2
器 测 量 造 成 一 定 影 响 。 图 6(d)~ (f) 给 出 了 工 况 5 中 房 间 内 部 爆 炸 冲 击 波 的 传 播 过 程 。 可 以 看 出 :
0.35 ms 时,初始入射冲击波在墙 2 处发生反射,压力达到峰值,随后冲击波向房间中心汇聚,压力下降。
1.8 2.5 5
P 1 , test P 1 , test
P 2 , test P 1 , test
1.5 2.3% P 1 , simulation 2.0 1.6% P 2 , test −27.9% P 2 , test
Overpressure/MPa 0.9 12.1% Overpressure/MPa 1.5 4.2% P 2 , simulation Overpressure/MPa 4 3 2 −9.5%
P 1 , simulation
P 1 , simulation
P 2 , simulation
P 2 , simulation
1.2
1.0
0.6
0.5
0.3
0 1 0
0
0 0.4 0.8 1.2 1.6 2.0 0 0.4 0.8 1.2 1.6 2.0 0 0.4 0.8 1.2 1.6 2.0
Time/ms Time/ms Time/ms
(a) Case 3 (b) Case 4 (c) Case 5
Wall 2 Wall 2 Wall 2 Pressure/MPa
P 1 P 1 P 1
0.25
0.22
0.19
0.16
0.13
0.10
(d) 0.2 ms, case 5 (e) 0.35 ms, case 5 (f) 1.0 ms, case 5
图 6 爆炸波超压时程对比和压力云图
Fig. 6 Comparisons of experimental and simulated overpressure histories and overpressure contours
图 7 对比了工况 4 和工况 5 中试验与数值模拟预测得到的侧墙各测点的位移时程曲线。可以看出,
除了工况 5 中的 DP 测点,其余测点预测的位移时程曲线与试验结果吻合较好,峰值位移的相对误差不
2
超过 20%。
013101-7