
Page 107 - 《爆炸与冲击》2026年第01期
P. 107
第 46 卷 陈 丁,等: 非药式水下爆炸冲击波加载的PD-SPH建模与分析 第 1 期
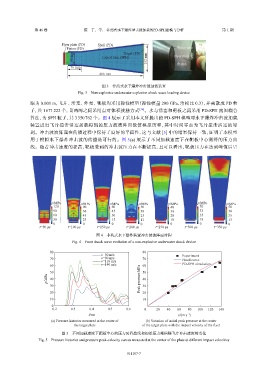
Flyer plate (PD) Shell (PD)
Piston (PD) Target (PD) Water tube
66 mm Liquid tank (SPH) 152 mm Flyer plate
76 mm Piston
406 mm
图 3 非药式水下爆炸冲击波加载装置
Fig. 3 Non-explosive underwater explosion shock wave loading device
距为 0.001 m,飞片、活塞、外壳、靶板均采用弹性模型(弹性模量 200 GPa,泊松比 0.3),并离散成 PD 粒
子,共 1 671 222 个,且两两之间采用点对体积接触方式 [36] 。水与活塞和靶板之间采用 PD-SPH 流固耦合
算法,为 SPH 粒子,共 3 350 762 个。图 4 展示了采用本文所提出的 PD-SPH 模型对水下爆炸冲击波加载
装置进行飞片撞击活塞加载得到的压力波波阵面数值模拟历程,其中时间零点为飞片撞击活塞的时
刻。冲击波波阵面在传播过程中保持了良好的平面性,这与文献 [5] 中的结果保持一致,证明了本模型
用于模拟水下爆炸冲击波的传播是可行的。图 5(a) 展示了不同加载速度下在靶板中心测得的压力曲
线。随着冲击速度的提高,靶板受到的冲击波压力在不断提高,且可以看出,靶板压力在达到峰值后呈
p/MPa p/MPa p/MPa p/MPa p/MPa p/MPa p/MPa
120 90 60 50 40 70 50
90 68 45 38 30 53 38
60 45 30 25 20 35 25
30 23 15 13 10 18 13
0 0 0 0 0 0 0
t=50 μs t=100 μs t=150 μs t=200 μs t=250 μs t=300 μs t=350 μs
图 4 非药式水下爆炸装置冲击波波阵面时程
Fig. 4 Front shock wave evolution of a non-explosive underwater shock device
80 80
v=50 m/s Experiment
70 v=80 m/s 70 Fitted curve
v=110 m/s
60 v=140 m/s 60 PD-SPH simulation
50 50
p/MPa 40 Peak pressure/MPa 40
30 30
20 20
10 10
0
0.2 0.3 0.4 0.5 0.6 0 20 40 60 80 100 120 140
−1
t/ms v/(m·s )
(a) Pressure histories measured at the center of (b) Variation of initial peak pressure at the center
the target plate of the target plate with the impact velocity of the flyer
图 5 不同加载速度下靶板中心的压力时程曲线和初始压力峰值随飞片冲击速度的变化
Fig. 5 Pressure histories and pressure peak-velocity curves measured at the center of the plate at different impact velocities
011107-7