
Page 92 - 《渔业研究》2026年第3期
P. 92
第 3 期 周竹黎等: 北部湾北部沿岸海域截尾白姑鱼时空分布格局及其与环境因子关系 385
2.4 截尾白姑鱼资源与环境因子的关系 果良好(表 2) ,结果揭示了环境因子间的交互作
基于两季及季度数据建立的 SEM 模型拟合效 用及其对截尾白姑鱼资源分布的影响。
表 2 SEM 评价结果
Tab. 2 Evaluated results of SEM
SEM 拟合结果 Fitting results of SEM
参考指标 适配标准
Indices Evaluation standards 两季 春季 秋季
Two-seasons Spring Autumn
显著性概率 P >0.05 0.59 0.42 0.85
近似误差平方根 RMSEA ≤0.08 0 0 0
塔克−刘易斯指数 TLI ≥0.90 1.03 1.00 1.12
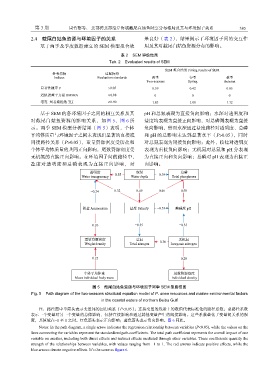
基于 SEM 的各环境因子之间的相互关系及其 pH 和总氮表现为直接负向影响;水深对透明度和
对截尾白姑鱼资源的影响关系,如图 5、图 6 所 盐度均表现为直接正向影响,对总磷则表现为直接
示。两季 SEM 模型分析结果(图 5)表明,个体 负向影响,然而水深通过盐度路径对透明度、总磷
平均体质量与环境因子之间未表现出显著的直接或 和 pH 的总影响未达到显著水平(P>0.05) ,同时
间接路径关系(P>0.05) ,重量资源密度受铵盐和 对总氮表现为间接负向影响;此外,铵盐对透明度
个体平均体质量的共同正向影响,尾数资源密度受 表现为直接负向影响;无机氮对总氮和 pH 分表现
无机氮的直接正向影响。在环境因子间的路径中, 为直接正向和负向影响;总磷对 pH 表现为直接正
盐度对透明度和总磷表现为直接正向影响,对 向影响。
透明度 0.55 水深 −0.39 总磷
Water transparency Water depth Total phosphorus
−0.24 0.32 0.49 0.46 0.58
铵盐 Ammonium 盐度 Salinity −0.33 酸碱度 pH
0.26 −0.35 −0.35
重量资源密度 总氮 0.36 无机氮
Weight density Total nitrogen Inorganic nitrogen
0.25 0.28
个体平均体重 尾数资源密度
Mean individual body mass Individual density
图 5 截尾白姑鱼资源与环境因子两季 SEM 型路径图
Fig. 5 Path diagram of the two-seasons structural equation model of P. anea resources and marine environmental factors
in the coastal waters of northern Beibu Gulf
注:路径图中单箭头表示变量间的回归关系(P<0.05) ;连接变量的线条上的数值代表标准化的路径系数;总路径系数
表示一个变量对另一个变量的总体影响,包括直接影响和通过其他变量产生的间接影响。这些系数量化了变量间关系的强
度,其值域在−1 至 1 之间。红色箭头表示正向影响;蓝色箭头表示负向影响。图 6 同此。
Notes: In the path diagram, a single arrow indicates the regression relationship between variables (P<0.05), while the values on the
lines connecting the variables represent the standardized path coefficients. The total path coefficient represents the overall impact of one
variable on another, including both direct effects and indirect effects mediated through other variables. These coefficients quantify the
strength of the relationships between variables, with values ranging from −1 to 1. The red arrows indicate positive effects, while the
blue arrows denote negative effects. It’s the same as figure 6.