
Page 136 - 《运动与健康科学》(英文)2024年第2期
P. 136
258 W. Chen et al.
TaggedAPTARAPLogistic regression analyses were applied to identify poten-
TaggedAPTARAH22.4. Outcome measuresTaggedAPTARAEnd
tial risk factors for the onset of overall AT, insertional AT, and
TaggedAPTARAPThe primary outcome measure was the incidence of
midportion AT. The analyses were conducted between partici-
self-reported AT using the standardized pain map during follow-
pants who developed a new-onset AT and those who had no
up. A new-onset AT was determined when the participant
new running-related injury during the follow-up. First, univar-
reported a new injury at the location of the Achilles tendon
iate logistic regression analyses of potential risk factors were
caused by running but had been asymptomatic at baseline. An
performed. Thereafter, variables with a p value of <0.2 in the
injury was defined as a musculoskeletal symptom resulting in (a)
univariate analysis were entered into the multivariable logistic
a reduction of training volume (running distance, speed, duration,
regression (ENTER model). The results were expressed as
or frequency) 1 week or 3 successive planned training sessions,
odds ratio (OR) with 95%CI.TaggedAPTARAEnd
or (b) a consultation with a health professional. The pain map
TaggedAPTARAPA sensitivity analysis on potential risk factors was carried
(Fig. 1) was provided in the questionnaire for participants who
out in participants that completed all 3 follow-up question-
reported a new-onset AT to select the specific location of symp-
naires. The statistical analysis was conducted using SPSS
toms on the Achilles tendon. A recent publication showed that
(Version 26.0; IBM Corp., Armonk, NY, USA). A p value of
the agreement between patient-reported pain on a pain map and
21
clinical diagnosis by a physician is almost perfect. If a partici- <0.05 was considered statistically significant.TaggedAPTARAEnd
pant selected both the insertional and midportion part of Achilles
tendon, this was regarded as a combined type of AT. If the TaggedAPTARAH13. ResultsTaggedAPTARAEnd
participant selected a different location on the Achilles tendon
TaggedAPTARAH23.1. Participant characteristicsTaggedAPTARAEnd
pain map at different follow-up time-points, the first chosen AT
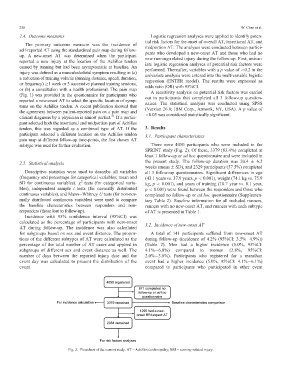
TaggedAPTARAPThere were 4050 participants who were included in the
subtype was used for further evaluation.TaggedAPTARAEnd
SPRINT study (Fig. 2). Of these, 3379 (83.4%) completed at
least 1 follow-up or ad hoc questionnaire and were included in
the present study. The follow-up duration was 20.4 § 6.2
TaggedAPTARAH22.5. Statistical analysisTaggedAPTARAEnd
weeks (mean § SD), and 2329 participants (57.5%) completed
TaggedAPTARAPDescriptive statistics were used to describe all variables all 3 follow-up questionnaires. Significant differences in age
(frequency and percentage for categorical variables; mean and (43.1 years vs. 37.9 years, p < 0.001), weight (74.1 kg vs. 75.9
2
SD for continuous variables). x tests (for categorical varia- kg, p < 0.001), and years of training (10.7 year vs. 8.1 year,
bles), independent sample t tests (for normally distributed p < 0.001) were found between the responders and those who
continuous variables), and MannWhitney U tests (for non-nor- completed no follow-up or ad hoc questionnaire (Supplemen-
mally distributed continuous variables) were used to compare tary Table 2). Baseline information for all included runners,
the baseline characteristics between responders and non- runners with no new-onset AT, and runners with each subtype
responders (those lost to follow-up).TaggedAPTARAEnd
of AT is presented in Table 1.TaggedAPTARAEnd
TaggedAPTARAPIncidence with 95% confidence interval (95%CI) was
calculated as the percentage of participants with new-onset
TaggedAPTARAH23.2. Incidence of new-onset ATTaggedAPTARAEnd
AT during follow-up. The incidence was also calculated
for subgroups based on sex and event distance. The propor- TaggedAPTARAPA total of 141 participants suffered from new-onset AT
tions of the different subtypes of AT were calculated as the during follow-up (incidence of 4.2% (95%CI: 3.5%4.9%))
percentage of the total number of AT cases and applied in (Table 2). Men had a higher incidence (5.0%, 95%CI:
subgroups of different sex and event distance as well. The 4.1%6.0%) compared to women (2.8%, 95%CI:
number of days between the reported injury date and the 2.0%3.8%). Participants who registered for a marathon
event day was calculated to present the distribution of the event had a higher incidence (5.0%, 95%CI: 4.1%6.1%)
compared to participants who participated in other event
event.TaggedAPTARAEnd
TaggedAPTARAFigure
Fig. 2. Flowchart of the current study. AT = Achilles tendinopathy; RRI = running-related injury.TaggedAPTARAEnd