Page 137 - 《水产学报》2026年第01期
P. 137

1 期                                     水    产    学    报                                 50 卷

                               1.0  flow direction                              fish movement direction
                                    水流方向
                                                                                  鱼类运动方向
                           水槽纵向距离/m flume longitudinal distance  0.5 0  upstream tank  a b c  高流速区 high velocity area  适应区  staging area  downstream tank
                                                                                      后蓄水池
                                     前蓄水池
                                                           中流速区 medium velocity area
                                                           低流速区 low velocity area
                                                          2.5
                                                                    3.5
                                                               3.0
                                                          水槽横向距离/m
                                  0   0.5  1.0  1.5  2.0 flume transverse distance 4.0  4.5  5.0  5.5  6.0
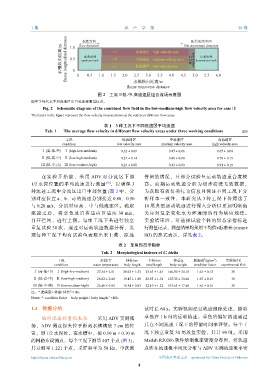
                                           图 2    工况Ⅲ低-中-高流速区组合流场示意图
              图中字母代表不同流速区出口处流速测量标点。
                   Fig. 2 Schematic diagram of the combined flow field in the low-medium-high flow velocity area for case Ⅲ
              The letters in the figure represent the flow velocity measurements at the outlets of different flow areas.


                                             表 1    3  种工况下不同流速区平均流速
                    Tab. 1       The average flow velocity in different flow velocity areas under three working conditions  m/s
                             工况                      低流速区                中流速区                 高流速区
                            condition              low velocity area  medium velocity area  high velocity area
                   Ⅰ (高-低-中) Ⅰ (high-low-medium)     0.32 ± 0.09         0.47 ± 0.06          0.65 ± 0.08
                   Ⅱ (低-高-中) Ⅱ (low-high-medium)     0.27 ± 0.14         0.48 ± 0.08          0.78 ± 0.15
                   Ⅲ (低-中-高) Ⅲ (low-medium-high)     0.23 ± 0.08         0.43 ± 0.09          0.91 ± 0.19

                   在 实 验 开 始 前 , 采 用    ADV  对 分 流 区 下 游       停留的情况,且部分试验鱼运动轨迹重合度较
              1/2  水深位置的平均流速进行测量              [18] ,以确保  3     高。前期运动轨迹分析为初步清洗无效数据,
              种流速工况中分流区出口中部位置                  (图  2  中,分      为获取有效鱼类行为信息且保证不同工况下分
              别对应位置       a、b、c) 的流速分别接近         0.80、0.50     析样本一致性,本研究从              3  种工况下各筛选了
              与  0.20 m/s,分别对应高、中与低流速区。确定                      10  尾典型运动轨迹进行深入分析以更加明晰鱼
              流 速 之 后 , 将 草 鱼 放 置 在 适 应 区 适 应       30 min,    类应对复杂变化水力环境时的行为响应规律。
              打开拦网,进行上溯。每组工况下共进行独立                             实验结束后,对选择试验个体的形态学指标进
              重复试验     30  次,通过对运动轨迹数据分析,发                     行测量记录,测量结果均采用平均值±标准差                  (mean±
              现每种工况下均有试验鱼表现出未上溯、原地                             SD) 的形式表示,详见表          2。

                                                    表 2    草鱼形态学指标
                                            Tab. 2    Morphological indexes of C. idella
                          工况                水温/℃       体长/cm    全长/cm      体重/g     肥满度 /(g/cm )  实验鱼/尾
                                                                                            3
                                                                                        *
                        condition        water temperature  body length  total length  body weight  condition factor  experimental fish
               Ⅰ (高-低-中) Ⅰ (high-low-medium)  27.34 ± 2.81  20.63 ± 1.53  23.63 ± 1.43  146.50 ± 34.10  1.63 ± 0.12  30
               Ⅱ (低-高-中) Ⅱ (low-high-medium)  26.62 ± 0.40  19.45 ± 1.40  22.85 ± 1.34  125.30 ± 34.44  1.67 ± 0.16  30
               Ⅲ (低-中-高) Ⅲ (low-medium-high)  26.40 ± 0.82  18.34 ± 0.83  22.19 ± 1.22  103.63 ± 17.48  1.65 ± 0.10  30
                               3
              注:*.肥满度= 体重/ 体长 ×100。
                                               3
              Notes: *. condition factor = body weight / body length   ×100.
               1.4    数据分析                                     试时长   60 s。实验视频经过轨迹跟踪处理,提取

                    偏好流速的量化表征  采用              ADV  实测流        草鱼在   1 h  内的运动轨迹。草鱼的偏好流速通过
              场,ADV    测点探头位于距离水槽槽底               7 cm  的位     其在不同流速工况下的停留时间来评估。每个工
              置,即    1/2  水深处。在水槽中,按         0.10 m × 0.10 m   况下独立重复       30  尾放鱼实验,共计        90  组。采用
              的网格布设测点,每个工况下测量                407  个点  (图  3),  Matlab R2020b  软件绘制概率密度分布图,将轨迹
              共计测量     1 221  个点,采样频率为       50 Hz,单次测         点所在流速概率密度分布与             ADV  实测流速概率密

              https://www.china-fishery.cn                           中国水产学会主办    sponsored by China Society of Fisheries
                                                            4
   132   133   134   135   136   137   138   139   140   141   142