
Page 207 - 《水产学报》2025年第12期
P. 207
母刚,等 水产学报, 2025, 49(12): 129516
1.8 1.8
数据 data 数据 data
1.6 拟合 fitting 1.6 拟合 fitting
Y=T Y=T
1.4 R=0.999 76 1.4 R=0.999 97
1.2 1.2
输出 output 1.0 输出 output 1.0
0.8 0.8
0.6 0.6
0.4 0.4
0.2 0.2
0.5 1.0 1.5 0.5 1.0 1.5
目标 目标
target target
(a) (b)
1.8 1.8
数据 data 数据 data
1.6 拟合 fitting 1.6 拟合 fitting
Y=T Y=T
1.4 R=0.996 73 1.4 R=0.999 72
1.2 1.2
输出 output 1.0 输出 output 1.0
0.8 0.8
0.6 0.6
0.4 0.4
0.2 0.2
0.5 1.0 1.5 0.5 1.0 1.5
目标 目标
target target
(c) (d)
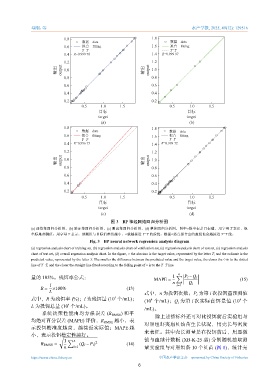
图 3 BP 神经网络回归分析图
(a) 训练集回归分析图,(b) 验证集回归分析图,(c) 测试集回归分析图,(d) 整体回归分析图。图中○横坐标是目标值,用字母 T 表示,纵
坐标是预测值,用字母 Y 表示。预测值与目标值差值越小,○就越接近 Y=T 的虚线,根据○落点拟合出的直线也会越接近 Y=T 线。
Fig. 3 BP neural network regression analysis diagram
(a) regression analysis chart of training set, (b) regression analysis chart of verification set, (c) regression analysis chart of test set, (c) regression analysis
chart of test set, (d) overall regression analysis chart. In the figure, ○ the abscissa is the target value, represented by the letter T, and the ordinate is the
predicted value, represented by the letter Y. The smaller the difference between the predicted value and the target value, the closer the ○ is to the dotted
line of Y=T, and the closer the straight line fitted according to the falling point of ○ is to the Y=T line.
量的 105%。残饵率公式: 1 n ∑ P i − Q i
MAPE = (15)
n Q i
l i=1
R = ×100% (13)
L 式中,n 为投饵次数;P 为第 i 次投饵量预测值
i
4
式中,R 为残饵率 (%);l 为残饵量 (10 个/mL); (10 个/mL);Q 为第 i 次实际食饵量值 (10 个
4
4
i
4
L 为投饵总量 (10 个/mL)。
/mL)。
系统决策性能由均方根误差 (R RMSE ) 和平 除上述指标外还可对比投饵前后实验组与
均绝对百分误差 (MAPE) 评价,R RMS E 越小,表 对照组虾夷扇贝幼苗生长状况,用壳长与密度
示投饵精准度越高,越接近实际值;MAPE 越
来表征。其中壳长测量是在投饵前后,用显微
小,表示投饵稳定性越好。
√
1 ∑ n 2 镜与血球计数板 (XB-K-25 型) 分别随机抽取测
R RMSE = (Q i − P i ) (14)
n i=1 量实验组与对照组各 10 个贝苗 (图 8),统计壳
https://www.china-fishery.cn 中国水产学会主办 sponsored by China Society of Fisheries
6