Page 187 - 《软件学报》2020年第11期
P. 187

徐鲲鹏  等:类属型数据核子空间聚类算法                                                            3503


                       Table 4   Comparison of F-score and Accuracy by different algorithms, on the real-world datasets
                                 表 4   真实类属型数据集上不同算法的 F-score 和 Accuracy 指标对比
                          指标           数据集          KSCC         WKM         MWKM          KKM
                                     Breastcancer   0.9659±0.00   0.7713±0.06  0.8514±0.06  0.9125±0.02
                                       Vote       0.8841±0.00   0.8223±0.06  0.8623±0.06  0.8438±0.04
                                      Mushroom    0.7733±0.13   0.6746±0.08  0.7136±0.08  0.7014±0.02
                          F-score
                                     Soybeansmall   0.8975±0.04   0.7538±0.13  0.7938±0.13  0.8126±0.07
                                     Dermatology   0.7241±0.02   0.6442±0.11  0.6542±0.11  0.6717±0.02
                                        Zoo       0.7603±0.05   0.7425±0.03   0.7625±0.03  0.7625±0.05
                                     Breastcancer   0.9654±0.00   0.8103±0.03  0.8631±0.03  0.9154±0.03
                                       Vote       0.8805±0.00  0.8324±0.06   0.8824±0.06   0.8562±0.04
                                      Mushroom    0.7856±0.08   0.6862±0.12  0.7195±0.12  0.7326±0.03
                         Accuracy
                                     Soybeansmall   0.9326±0.03   0.7869±0.12  0.8069±0.12  0.8155±0.07
                                     Dermatology   0.8678±0.04   0.6821±0.08  0.6821±0.08  0.6959±0.02
                                        Zoo       0.7732±0.03  0.7726±0.04   0.8126±0.04  0.7789±0.02
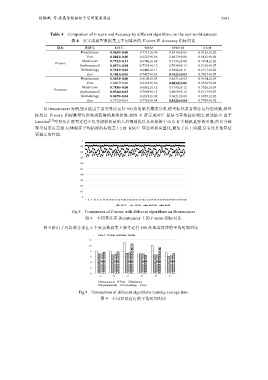
                    以 Breastcancer 为例,图 8 给出了各类算法运行 100 次的聚类精度分布,横坐标代表各算法运行的次数,纵坐
                 标是以 F-score 指标衡量每次聚类获得的聚类结果.如图 8 所示,KSCC 算法与其他算法相比,波动最小.由于
                 k-modes [15] 型算法在聚类过程中仅考虑模而易陷入局部最优以及初始簇中心为 K 个随机选择的对象,所以导致
                 聚类结果反差很大(体现在平均精度的标准差上).而 KSCC 算法将模向量化,避免了以上问题,具有比其他算法
                 更稳定的性能.
                                     1
                                     0.9
                                     0.8
                                     0.7
                                     0.6
                                     0.5
                                     0.4
                                     0.3
                                     0.2
                                     0.1
                                     0
                                       1 4 7 10 13 16 19 22 25 28 31 34 37 40 43 46 49 52 55 58 61 64 67 70 73 76 79 82 85 88 91 94 97100
                                                       KSCC  WKM   MWKM   KKM
                                 Fig.8   Comparison of F-score with different algorithms on Breastcancer
                                       图 8   不同算法在 Breastcancer 上的 F-score 指标对比
                    图 9 给出了各算法分别在 6 个真实数据集上独立运行 100 次聚类花费的平均时间对比.

                                             KSCC  WKM  MWKM  KKM
                                         12
                                         10
                                         8
                                         6
                                         4
                                         2
                                         0
                                             A     B      C     D     E     F
                                            A:Breastcancer    B:Vote    C:Mushroom
                                            D:Soybean(small)     E:Dermatology    F:Zoo
                                    Fig.9    Comparison of different algorithms running average time
                                              图 9   不同算法运行的平均时间对比
   182   183   184   185   186   187   188   189   190   191   192