Page 120 - 摩擦学学报2025年第9期
P. 120

1374                                   摩擦学学报(中英文)                                        第 45 卷


                   1 N


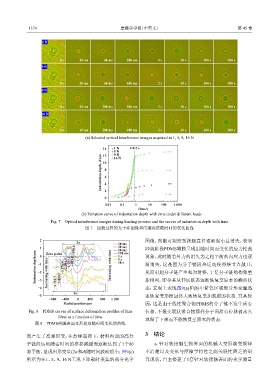
                           0 s     30 ms     40 ms     200 ms       2 s       10 s      100 s     300 s
                   5 N


                           0 s     20 ms     60 ms     400 ms       2 s       10 s      100 s     300 s
                   9 N


                           0 s     20 ms     100 ms    300 ms       2 s       10 s      100 s     300 s
                   16 N


                           0 s     10 ms     100 ms    400 ms       2 s       10 s      100 s     300 s
                                     (a) Selected optical interference images acquired at 1, 5, 9, 16 N

                                             14   1 N   t=0.7 s
                                                  5 N
                                                  9 N
                                             12
                                            Indentation depth, d/μm  10 8 6 4
                                                  16 N


                                              0 2
                                              0.01  0.1    1    10    100  1 000
                                                            Time/s
                                    (b) Variation curve of indentation depth with time under different loads
                       Fig. 7    Optical interference images during loading process and the curves of indentation depth with time
                                     图 7    加载过程的光干涉图像和压痕深度随时间的变化曲线

                  2                                            图像,肉眼可观察到接触直径逐渐缩小且消失,表明

                                  2a               10 ms
                  1 0  Zero point  −198.6          30 ms       卸载阶段PDMS薄膜呈现出随时间而变化的应力松弛
                                                   50 ms
                Indentation depth/μm  −1 Increasing with time  −3 376.4  −2 094.4  −1 183.2  −603.8  Increasing with time  5 s  渐消失,这是因为分子链段热运动使得缠节点散开,
                                                   150 ms
                                                   1 s
                                                               现象,此时随着外力的消失为之相平衡的内应力也逐
                                                   10 s
                 −2
                                                               从而引起分子链产生相对滑移,于是分子链的构象重
                 −3
                                                               态,宏观上表现图9(a)和(b)中紫色区域部分形变量迅
                 −4      −4 210.7  −3 800.7                    新排列,即令其从伸展状态逐渐恢复至原本的蜷曲状
                                2a
                 −5                                            速恢复变形而最终大致恢复至加载前的状态. 究其原
                      −800  −400  0   400   800  1 200
                            Radial position/μm                 因,这是由于线性聚合物PDMS的分子链不发生质心
             Fig. 8    PDMS curves of surface deformation profiles of thin  位移,不像交联状聚合物那样分子间质心位移被永久
                          films as a function of time
                                                               地留了下来而不能恢复至原本的状态.
                图 8    PDMS薄膜表面变形轮廓随时间变化的曲线

            而产生了高弹形变;在持续载荷下,材料内部的高分                             3    结论
            子链段运动随着时间的推移减缓而逐渐达到了1个动                                a. 针对软接触生物界面的机械大变形演变规律
            态平衡,呈现出形变量(2         a和d)随时间波动很小;图9(c)             不清楚以及变形与摩擦学特性之间关联性匮乏的研
            所示为在1、5、9、16 N工况下卸载时采集的部分光学                        究现状,自主搭建了1套针对软接触表面的光学测量
   115   116   117   118   119   120   121   122   123   124   125