


Page 132 - 《高原气象》2026年第5期
P. 132
高     原      气     象                                 45 卷
              1348


                                                                                    -1
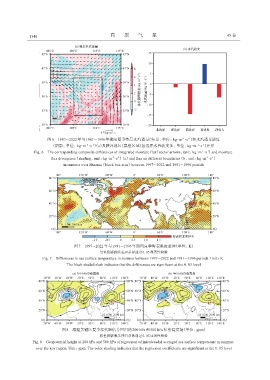
                       图6 1997 -2022年与1981 -1996年期间夏季整层水汽通量(矢量, 单位: kg·m ·s )和水汽通量散度
                                                                                      -1
                                           -1
                                        -2
                                                                                          -1
                                                                                             -1
                        (阴影, 单位: kg·m ·s )(a)及陕西地区(黑框区域)各边界水汽收支(b, 单位: kg·m ·s )差异
                                                                                            -1
                 Fig. 6 The corresponding composite differences of integrated moisture flux(vector arrows, unit: kg·m ·s ) and moisture
                                                                                               -1
                                                      -1
                                                    -2
                                                                                               -1
                                                                                                 -1
                        flux divergence (shading, unit: kg·m ·s ) (a) and flux on different boundaries (b, unit: kg·m ·s )
                              in summer over Shaanxi (black box area) between 1997 -2022 and 1981 -1996 periods


                                   图7 1997 -2022年与1981 -1996年期间夏季海表温度差异(单位: K)
                                              黑色阴影斜线表示差异通过0. 05显著性检验
                    Fig. 7 Differences in sea surface temperature in summer between 1997 -2022 and 1981 -1996 periods. Unit: K.
                               The black shaded slash indicates that the differences are significant at the 0. 05 level


                             图8 海温关键区夏季年代际信号回归的200 hPa和500 hPa位势高度场(单位: gpm)
                                              彩色阴影表示回归系数通过0. 05显著性检验
                Fig. 8 Geopotential height at 200 hPa and 500 hPa of regression of interdecadal averaged sea surface temperature in summer
                 over the key region. Unit: gpm. The color shading indicates that the regression coefficients are significant at the 0. 05 level

