


Page 128 - 《高原气象》2026年第5期
P. 128
高     原      气     象                                 45 卷
              1344
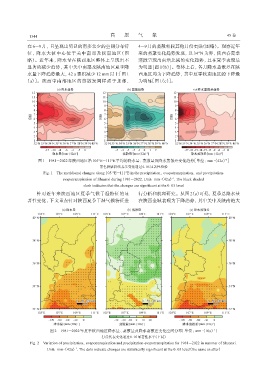
             在 6 -9月, 且呈现出明显的南多北少的空间分布特                         4 -9月的蒸散相较其他月份更强(图略)。观察近年
             征, 降水大值中心位于关中南部及陕南地区(图                             来的蒸散变化趋势发现, 以 34°N为界, 陕西春夏季
             略)。近年来, 降水量在陕西地区整体上呈现出不                            蒸散呈现出南增北减的变化趋势, 且在夏季表现最
             显著的减少趋势, 其中关中南部及陕南地区夏季降                            为明显[图 1(b)]。整体上看, 各月降水蒸散差在陕
             水量下降趋势最大, 42 a累积减少 12 mm 以上[图 1                    西地区均为下降趋势, 其中夏季陕南地区的下降最
             (a)]。陕西中南部地区的蒸散发同样强于北部,                            为明显[图1(c)]。


                                                                                                       -1
                  图1 1981 -2022年陕西地区沿105°E -111°E平均的降水量、 蒸散量及降水蒸散差变化趋势[单位: mm·(42a)]
                                              黑色阴影斜线表示变化通过0. 05显著性检验
                     Fig. 1 The meridional changes along 105 °E -111°E in the precipitation, evapotranspiration, and precipitation-
                             evapotranspiration of Shaanxi during 1981 -2022. Unit: mm·(42a) . The black shaded
                                                                               -1
                                       slash indicates that the changes are significant at the 0. 05 level
                  针对近年来陕西地区夏季气候干湿特征的显                           行分析和机理研究。从图 2(a)可见, 夏季总降水量
             著性变化, 下文重点针对陕西夏季干湿气候特征进                            在陕西全域表现为下降趋势, 其中关中及陕南绝大


                                                                                                  -1
                        图2 1981 -2022年夏季陕西地区降水量、 蒸散量及降水蒸散差变化空间分布[单位: mm·(10a)]
                                               打点代表变化通过0. 05显著性水平(下同)
               Fig. 2 Variation of precipitation, evapotranspiration and precipitation-evapotranspitation for 1981 -2022 in summer of Shaanxi.
                                   -1
                      Unit: mm·(42a) . The dots indicate changes are statistically significant at the 0. 05 level(the same as after)

