


Page 30 - 《高原气象》2026年第4期
P. 30
高     原      气     象                                 45 卷
              960


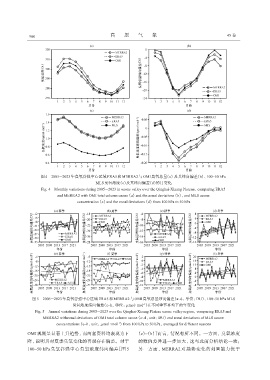
                    图4 2005 -2023年臭氧谷强中心区域ERA5和MERRA2与OMI臭氧总量(a) 及其纬向偏差(b)、 100~50 hPa
                                            MLS臭氧浓度(c)及其纬向偏差(d)的月变化
                    Fig. 4 Monthly variations during 2005 -2023 in ozone valley over the Qinghai-Xizang Plateau, comparing ERA5
                           and MERRA2 with OMI total column ozone (a) and the zonal deviations (b), and MLS ozone
                                    concentration (c) and the zonal deviations (d) from 100 hPa to 50 hPa


                图5 2005 -2023年臭氧谷强中心区域ERA5和MERRA2与OMI臭氧总量纬向偏差(a~d, 单位: DU)、 100~50 hPa MLS
                                  臭氧浓度纬向偏差(e~h, 单位: μmol·mol )在不同季节平均下的年变化
                                                                  -1
                 Fig. 5 Annual variations during 2005 -2023 over the Qinghai-Xizang Plateau ozone valley region, comparing ERA5 and
                    MERRA2 withzonal deviations of OMI total column ozone (a~d, unit: DU) and zonal deviations of MLS ozone
                                                      -1
                           concentrations (e~h, unit: μmol·mol ) from 100 hPa to 50 hPa, averaged for different seasons
             OMI观测呈显著上升趋势, 而两套资料均表现为下                          (e)~(h)]而言, 情况有所不同。一方面, 臭氧浓度
             降, 说明其对夏季臭氧变化的再现存在偏差。对于                            的数值差异进一步加大, 这与此前分析结论一致;
             100~50 hPa 臭氧谷强中心臭氧浓度纬向偏差[图 5                      另一方面, MERRA2 对趋势变化的刻画能力优于

