


Page 28 - 《高原气象》2026年第4期
P. 28
高     原      气     象                                 45 卷
              958


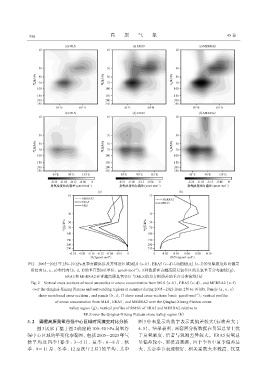
              图2 2005 -2023年250~10 hPa夏季青藏高原及其邻近区域MLS (a~b)、 ERA5 (c~d)与MERRA2 (e~f)的臭氧浓度纬向偏差
               沿经向(a, c, e)和纬向(b, d, f)的垂直剖面(单位: μmol·mol ); 3种数据在青藏高原臭氧谷区的臭氧垂直分布廓线(g),
                                                              -1
                              ERA5和MERRA2在青藏高原臭氧谷区与MLS的均方根误差的垂直分布廓线(h)
               Fig. 2 Vertical cross-sections of zonal anomalies in ozone concentration from MLS (a~b), ERA5 (c~d), and MERRA2 (e~f)
                over the Qinghai-Xizang Plateau and surrounding regions in summer during 2005 -2023 from 250 to 10 hPa. Panels (a, c, e)
                  show meridional cross-sections, and panels (b, d, f) show zonal cross-sections (unit: μmol·mol ); vertical profiles
                                                                                          -1
                          of ozone concentration from MLS, ERA5, and MERRA2 over the Qinghai-Xizang Plateau ozone
                                valley region (g); vertical profiles of RMSE of ERA5 and MERRA2 relative to
                                       MLS over the Qinghai-Xizang Plateau ozone valley region (h)
             3. 2 青藏高原臭氧谷强中心区域时间演变对比分析                          图 3 中未显示的数字表示其偏差较大(标准差大于
                  图 3 展示了基于图 2 确定的 100~50 hPa 臭氧谷               4. 5)。结果表明, 两套再分析数据在臭氧总量上优
             强中心区域的年变化泰勒图, 包括 2005 -2023年气                      于臭氧浓度, 后者与观测差异较大。ERA5 臭氧总
             候平均及四季(春季: 3 -5 月、 夏季: 6 -8 月、 秋                   量偏差较小, 更接近观测, 四个季节中夏季偏差最
             季: 9 -  11 月、 冬季: 12 至次年 2 月)的平均, 其中               大, 其余季节表现较好, 相关系数大多较高, 仅夏

