


Page 232 - 《高原气象》2026年第4期
P. 232
高     原      气     象                                 45 卷
              1162


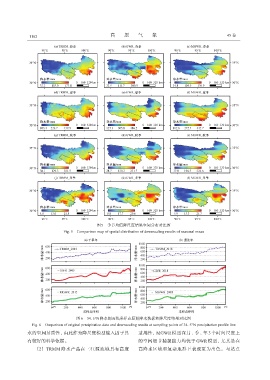
                                             图5 季节均值降尺度结果空间分布对比图
                              Fig. 5 Comparison map of spatial distribution of downscaling results of seasonal mean


                                    图6 34. 5°N降水剖面线采样点原始降水数据和降尺度结果对比图
                Fig. 6 Omparison of original precipitation data and downscaling results at sampling points of 34. 5°N precipitation profile line
             水的空间异质性, 由此作为降尺度模型输入因子具                            适用性, MGWR 模型在月、 季、 年 3 个时间尺度上

             有较好的科学依据。                                          的空间细节捕捉能力均优于 GWR 模型, 尤其是在
                 (2)  TRMM 降水产品在三江源流域具有高度                       高降水区域和复杂地形下表现更为出色。与站点

