


Page 131 - 《高原气象》2026年第4期
P. 131
4 期                       胡海川等:基于平均风分量的阵风风速参数化方法研究                                         1061
               2013), 因此本文分别基于数值模式预报的 10 m 的                     偏西风或偏南风分量较大时, 道孚站出现更大阵风
               u、 v风分量构建阵风参数化模型。                                 的可能性更高。道孚站地处西北至东南走向的山

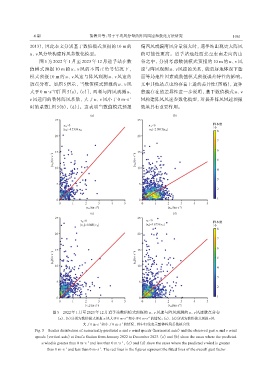
                   图 5 为 2022 年 1 月至 2023 年 12 月道孚站在数            谷之中, 分别考虑数值模式预报的 10 m 的 u、 v 风
               值模式预报 10 m 的 u、 v 风的不同正负号情况下,                     速与阵风观测 u、 v风速的关系, 能更好地体现下垫
               模式预报 10 m 的 u、 v 风速与阵风观测 u、 v 风速的                 面等局地性因素或数值模式预报误差特性的影响。
               散点分布。如图 5 所示, 当数值模式预报的 u、 v 风                     文中其他站点也均存着上述的差异性(图略), 这种
                        -1
               大于 0 m·s 时[图 5(a), (c)], 两者与阵风观测 u、               普遍存在的差异性进一步说明, 基于数值模式 u、 v
               v 风速间的整体阵风系数, 大于 u、 v 风小于 0 m·s              -1   风构建阵风风速参数化模型, 对提升阵风风速预报

               时的系数[图 5(b), (d)]。这表明当数值模式预报                      效果具有重要作用。


                         图5 2022年1月至2023年12月道孚站数值模式预报的 u、 v 风速与阵风观测的u、 v风速散点分布
                                                          -1
                           (a)、 (b)分别为数值模式预报 u 风大于0 m·s 和小于0 m·s 的情况; (c)、 (d)分别为数值模式预报v风
                                                                    -1
                                                        -1
                                              -1
                                       大于0 m·s 和小于0 m·s 的情况, 图中红线表示整体阵风系数拟合线
                 Fig. 5 Scatter distribution of numerically predicted u and v wind speeds (horizontal axis) and the observed gust u and v wind
                 speeds (vertical axis) at Daofu Station from January 2022 to December 2023. (a) and (b) show the cases where the predicted
                                                        -1
                                        -1
                    u wind is greater than 0 m·s  and less than 0 m·s , (c) and (d) show the cases where the predicted v wind is greater
                      than 0 m·s  and less than 0 m·s . The red lines in the figures represent the fitted lines of the overall gust factor
                                              -1
                              -1

