


Page 121 - 《高原气象》2026年第4期
P. 121
4 期                         黎文懋等:云南省极端降水多模式可预报性评估                                          1051


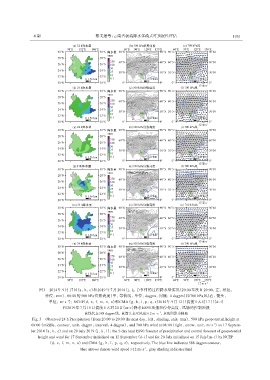
                   图3 2014年9月17日(a, b, c)和2019年7月20日(j, k, l)事件的过程降水量实况(20:00至次日20:00, 左, 填色,
                      单位: mm)、 08:00的500 hPa位势高度(中, 等值线, 单位: dagpm, 间隔: 4 dagpm)和700 hPa风(右, 箭头,
                               -1
                       单位: m·s ); NCEP(d, e, f, m, n, o)和CMA (g, h, i, p, q, r)2014年9月12日提前5天对17日(d~i)
                             和2019年7月15日提前5天对20日(m~r)降水ES90预报和位势高度、 风场的控制预报
                                                                         -1
                                       蓝线代表588 dagpm线, 蓝箭头表示风速≥12 m·s , 灰色阴影为陆地
                Fig. 3 Observed 24 h Precipitation (from 20:00 to 20:00 the next day, left, shading,unit: mm), 500 hPa geopotential height at
               08:00 (middle, contour, unit: dagpm; interval: 4 dagpm), and 700 hPa wind at 08:00 (right, arrow, unit: m·s ) on 17 Septem‐
                                                                                                  -1
               ber 2014 (a, b, c) and on 20 July 2019 (j, k, l); the 5-day lead ES90 forecast of precipitation and control forecast of geopotential
                  height and wind for 17 September initialized on 12 September (d~i) and for 20 July initialized on 15 July(m~r) by NCEP
                       (d, e, f, m, n, o) and CMA (g, h, I, p, q, r), respectively. The blue line indicates 588 dagpm contour,
                                     blue arrows denote wind speed ≥12 m·s , gray shading indicates land
                                                                  -1

