


Page 90 - 《高原气象》2026年第3期
P. 90
高     原      气     象                                 45 卷
              698


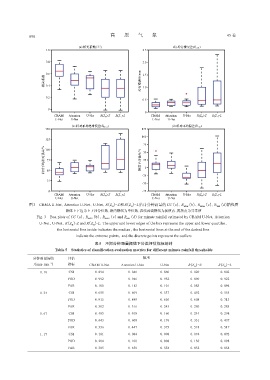
              图3 CBMA U-Net、 Attention U-Net、 U-Net、 R(Z )-Z和R(Z )-L估计分钟雨量的CC (a)、 R MSE   (b)、 R MAE   (c)、 R  (d)箱线图
                                                            H
                                                    H
                                                                                                   MB
                               箱体上下边为上下四分位数,箱内横线为中位数,虚线两端横线为极值点,离散点为异常值
                  Fig. 3 Box plots of CC (a), R MSE   (b), R MAE   (c) and R  (d) for minute rainfall estimated by CBAM U-Net, Attention
                                                          MB
                   U-Net, U-Net, R(Z )-Z and R(Z )-L. The upper and lower edges of the box represent the upper and lower quartiles,
                                  H
                                           H
                           the horizontal line inside indicates the median, the horizontal lines at the end of the dashed line
                                   indicate the extreme points, and the discrete points represent the outliers
                                            表5  不同分钟雨量阈值下分类评估指标统计
                          Table 5  Statistics of classification evaluation metrics for different minute rainfall thresholds
                分钟雨量阈值          评估                                模型
                       -1
                / (mm·min )     指标        CBAM U-Net    Attention U-Net   U-Net       R(Z )-Z       R(Z )-L
                                                                                         H             H
                   0. 10        CSI         0. 894         0. 846         0. 860       0. 820        0. 842
                                POD         0. 992         0. 946         0. 952       0. 890        0. 922
                                FAR         0. 100         0. 112         0. 101       0. 088        0. 094
                   0. 34        CSI         0. 655         0. 609         0. 537       0. 492        0. 555
                                POD         0. 915         0. 849         0. 650       0. 608        0. 713
                                FAR         0. 302         0. 316         0. 243       0. 280        0. 285
                   0. 67        CSI         0. 485         0. 408         0. 160       0. 244        0. 298
                                POD         0. 643         0. 608         0. 176       0. 331        0. 437
                                FAR         0. 336         0. 447         0. 373       0. 518        0. 517
                   1. 17        CSI         0. 181         0. 084         0. 008       0. 074        0. 092
                                POD         0. 204         0. 100         0. 008       0. 130        0. 198
                                FAR         0. 385         0. 650         0. 538       0. 852        0. 854

