
Page 235 - 《高原气象》2026年第2期
P. 235
2 期 张文韬等:印太海温异常对中国冬季降水变化的调控关系 535
东、 西路径。 趋势。从图 2(a)可以看出, 冬季降水总体呈现增加
-1
趋势, 平均线性增加率为 1. 56 mm·(10a) , 东南
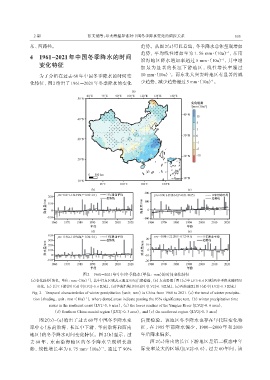
4 1961 --2021 年中国冬季降水的时间 沿海地区降水增加率超过 5 mm·(10a) , 其中增
-1
变化特征 加 最 为显著的长江下游地区, 线性增长率超过
-1
为了分析在过去 60 年中国冬季降水的时间变 10 mm·(10a) 。而东北大兴安岭地区有显著的减
-1
化特征, 图 2 给出了 1961 -2021 年冬季降水的变化 少趋势, 减少趋势超过5 mm·(10a) 。
图2 1960 -2021年中国冬季降水(单位: mm)的时间变化特征
-1
(a)变化趋势[填色, 单位: mm·(10a) ], 其中打点区域表示通过95%信度检验, (b) 东南沿海 [图1(c)中LV1>0. 6区域]的冬季降水随时间
变化, (c) 长江下游[图1(d)中| LV2|>0. 6区域], (d)华南沿海[图1(d)中| LV2|>0. 3区域], (e)西南地区[图1(d)中| LV2|>0. 3区域]
Fig. 2 Temporal characteristics of winter precipitation (unit: mm) in China from 1960 to 2021.(a) the trend of winter precipita‐
-1
tion [shading, unit: mm·(10a)], where dotted areas indicate passing the 95% significance test, (b) winter precipitation time
series in the southeast coast (LV1>0. 6 area), (c) the lower reaches of the Yangtze River (|LV2|>0. 6 area),
(d) Southern China coastal region (|LV2|>0. 3 area), and (e) the southwest region (|LV2|>0. 3 area)
图 2(b)~(e)给出了过去 60 年中国冬季降水变 信度检验。该地区冬季降水也存在年代际变化特
率中心(东南沿海、 长江中下游、 华南沿海和西南 征, 在 1985 年前降水偏少, 1980 -2000 年和 2010
地区)的冬季降水时间变化特征。图 2(b)显示, 过 年后降水偏多。
去 60 年, 东南沿海地区的冬季降水呈现增长趋 图 2(c)给出的长江下游地区是第二模态中年
势, 线性增长率为 6. 75 mm·(10a) , 通过了 90% 际变率最大的区域( | LV2|>0. 6), 过去 60 年间, 该
-1