
Page 119 - 《高原气象》2026年第1期
P. 119
1 期 刘旭东等:横断山区2001 -2020年小时极端降水时空分布特征 115
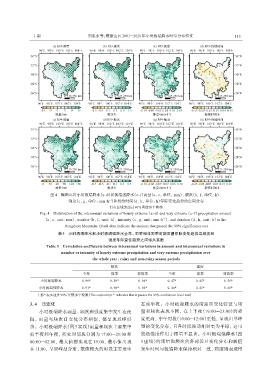
图4 横断山区小时极端降水(a~d)和极端强降水(e~f)雨量(a, e, 单位: mm)、 频次(b, f, 单位: h)、
强度(c, g, 单位: mm·h )和持续时间(d, h, 单位: h)年际变化趋势的空间分布
-1
打点区域为通过90%置信水平检验
Fig. 4 Distribution of the interannual variations of hourly extreme (a~d) and very extreme (e~f) precipitation amount
-1
(a, e, unit: mm), number (b, f, unit: h), intensity (c, g, unit: mm·h ), and duration (d, h, unit: h) in the
Hengduan Mountain. Black dots indicate the stations that passed the 90% significance test
表3 小时极端降水和小时极端强降水全年、 雨季和非雨季时期雨量年际变化趋势与频次和
强度年际变化趋势之间相关系数
Table 3 Correlation coefficients between interannual variations in amount and interannual variations in
number or intensity of hourly extreme precipitation and very extreme precipitation over
the whole year, rainy and non-rainy season periods
频次 强度
全年 雨季 非雨季 全年 雨季 非雨季
小时极端降水 0. 90* 0. 89* 0. 94* 0. 47* 0. 45* 0. 56*
小时极端强降水 0. 91* 0. 90* 0. 94* 0. 44* 0. 45* 0. 60*
上标*表示通过99%置信水平检验(The superscript * indicates that it passes the 99% confidence level test)
3. 4 日变化 在前半夜。小时极端降水的雨强日变化特征与雨
小时极端降水雨量、 频次和强度集中发生在夜 量和频次表现不同, 在上半夜(19:00 -23:00)的强
间, 雨量与频次日变化分布相似, 都呈现双峰形 度更高, 中午时段(10:00 -12:00)更低, 呈现出单峰
态。小时极端降水(图 5实线)雨量和频次主要集中 型的变化分布, 且各时段波动相对更为平稳, 这可
前半夜和午夜, 所处时间段分别为 17:00 -21:00 和 能是强度作用于雨量不显著。小时极端强降水(图
00:00 -02:00, 最大值都出现在 19:00, 最小值出现 5 虚线)的雨量和频次的各时段日变化分布和极值
在 11:00, 呈双峰型分布, 数值较大的时段主要发生 发生时间与极端降水保持相对一致, 强度则表现得