
Page 146 - 《高原气象》2023年第1期
P. 146
高 原 气 象 42 卷
142
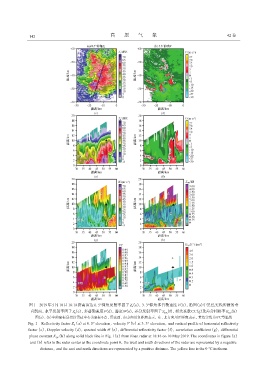
图1 2019年5月10日18:18济南雷达0. 5°仰角反射率因子Z(a), 3. 3°仰角多普勒速度V(b), 沿图(a)中黑色实线所做的垂
h
直剖面, 水平反射率因子Z(c), 多普勒速度V(d), 谱宽W(e), 差分反射率因子Z (f), 相关系数CC(g)及差分相移率K (h)
h
DR
DP
图(a)、 (b)中的坐标是指以雷达中心为坐标0点, 雷达西、 南方向用负距离表示, 东、 北方向用正距离表示, 黄色实线为0℃等温线
Fig. 1 Reflectivity factor Z (a) at 0. 5° elevation, velocity V (b) at 3. 3° elevation, and vertical profile of horizontal reflectivity
h
factor (c), Doppler velocity (d), spectral width W (e), differential reflectivity factor (f), correlation coefficient (g), differential
phase constant K (h) along solid black line in Fig. 1(a) from Jinan radar at 18:18 on 10 May 2019. The coordinates in figure (a)
DP
and (b) refer to the radar center as the coordinate point 0, the west and south directions of the radar are represented by a negative
distance, and the east and north directions are represented by a positive distance. The yellow line is the 0 ℃ isotherm