
Page 225 - 《高原气象》2022年第1期
P. 225
1 期 陈得圆等:四川盆地西部一次典型连续夜雨的数值模拟 223
3
-1
-9
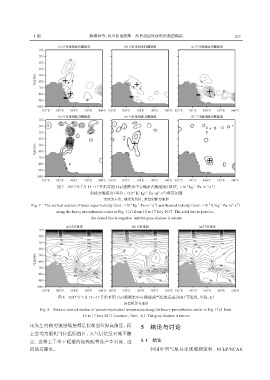
图7 2017年7月15 -17日沿着图1(a)强降水中心做水汽螺旋度(单位:×10 kg ·Pa·m·s )
-2
3
-2
-1
-2
和热力螺旋度(单位:×10 K·kg ·Pa·m·s )垂直剖面
实线为正值,虚线为负值,灰色阴影为地形
3
-2
-1
-2
3
-2
Fig. 7 The vertical section of water vapor helicity(unit:×10 kg ·Pa·m·s )and thermal helicity(unit:×10 K·kg ·Pa·m·s )
-9
-1
along the heavy precipitation center in Fig. 1(a)from 15 to 17 July 2017. The solid line is positive,
the dotted line is negative and the gray shadow is terrain
图8 2017年7月15-17日沿着图1(a)强降水中心做假相当位温垂直剖面(等值线,单位:K)
灰色阴影为地形
Fig. 8 Make a vertical section of pseudo-equivalent temperature along the heavy precipitation center in Fig. 1(a)from
15 to 17 July 2017(contour,Unit:K). The gray shadow is terrain
雨发生时的对流层低层都是假相当位温高值区,而 5 结论与讨论
上空均为假相当位温低值区,大气层结呈对流不稳
定,这种上干冷下暖湿的结构配置易产生对流,进 5. 1 结论
而诱发降水。 利用中国气象局常规观测资料、NCEP/NCAR