


Page 184 - 《爆炸与冲击》2026年第10期
P. 184
第 46 卷              刘洁宁,等: 内爆炸荷载下钢筋混凝土单房间的抗爆性能                                 第 10 期

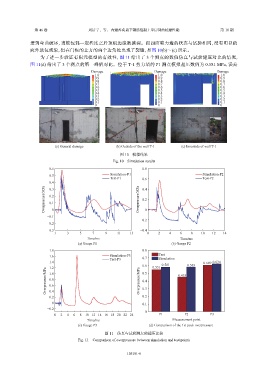
               遭到弯曲破坏,当鼓包到一定程度之后顶板边缘被撕裂。而四面剪力墙的状态与试验相同,没有明显的
               向外鼓包现象,但在门框的上方的两个边角处出现了裂缝,如图                            10(b)~(c) 所示。
                   为了进一步验证有限元模型的有效性,图                    11  给出了  3  个测点的数值仿真与试验超压对比的情况,
               图  11(d) 给出了  3  个测点的第一峰值对比。位于             T-1  剪力墙的   P1  测点模拟超压数值为         0.581 MPa,误差
                                          Damage                      Damage                     Damage

                                           1.0                         1.0                         1.0
                                           0.9                         0.9                         0.9
                                           0.8                         0.8                         0.8
                                           0.7                         0.7                         0.7
                                           0.6                         0.6                         0.6
                                           0.5                         0.5                         0.5
                                           0.4                         0.4                         0.4
                                           0.3                         0.3                         0.3
                                           0.2                         0.2                         0.2
                                           0.1                         0.1                         0.1
                                           0                           0                           0


                         (a) Genaral damage          (b) Outside of the wall T-1  (c) Innerside of wall T-1
                                                      图 10    模拟结果
                                                   Fig. 10    Simulation results
                       0.6                                      0.8

                       0.5                        Simulation-P1                            Simulation-P2
                                                  Test-P1       0.6                        Test-P2
                       0.4                                      0.4
                     Overpressure/MPa  0.2                     Overpressure/MPa  0.2
                       0.3

                       0.1

                      −0.1 0                                     0
                                                               −0.2
                      −0.2
                      −0.3                                     −0.4
                         1     3    5     7     9    11    13     0    2    4    6    8   10   12   14
                                        Time/ms                                  Time/ms
                                    (a) Gauge P1                             (b) Gauge P2
                       1.8                                      0.8
                       1.6                        Simulation-P3  0.7   Test
                                                                       Simulation
                       1.4                        Test-P3                0.581             0.609  0.624
                       1.2                                      0.5  0.551          0.583
                     Overpressure/MPa  0.8                     Overpressure/MPa 0.6  0.453
                       1.0
                                                                0.4
                       0.6
                                                                0.3
                       0.4
                       0.2                                      0.2
                        0                                       0.1
                      −0.2                                       0
                         0  2  4  6  8  10 12 14 16 18 20 22 24         P1         P2         P3
                                        Time/ms                               Measurement point
                                    (c) Gauge P3                   (d) Comparison of the 1st peak overpressure

                                                图 11    仿真与试验测点的超压比较
                                    Fig. 11    Comparison of overpressure between simulation and test points


                                                         105101-6

