


Page 202 - 《爆炸与冲击》2026年第3期
P. 202
第 46 卷          贾    果,等: 适用于激光驱动方式的金属粉末冲击压缩特性实验技术                              第 7 期

                              Y-axis            Z-axis            Y-axis               Z-axis


                        Copper
                        powder                               The crack in
                                                               copper
                                          X-axis    Upper                       X-axis
                       d=33.40 µm                  Interface   powder
                                           Copper   quartz
                                           powder   sheet                       Uneven filling of copper
                       Hole-quartz                                             powder at a certain depth in
                                                                                     the middle
                         sheet  Upper quartz
                            100 µm  layer      100 µm              100 µm              100 µm
                             (a) Uniformly inside copper powder  (b) Non-uniformity inside copper powder


                                                                ~300 µm
                                                   Quartz-quartz
                                                    interface:   Quartz-quartz interface:
                                                      clean       incomplete cleaning;
                                                                 copper powder spillage
                                            (c) Different treatments at the quartz quartz interface

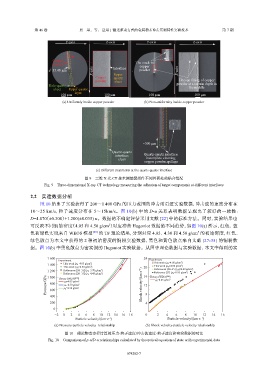
                                       图 9    三维  X  光  CT  技术测量靶部件不同界面处的贴合情况
                     Fig. 9    Three-dimensional X-ray CT technology measuring the adhesion of target components at different interfaces

                2.2    实验数据分析
                   图  10  给出了实验获得了       200~1 400 GPa 的压力范围的冲击雨贡纽实验数据,冲击波的速度分布在
               10~25 km/s,粒子速度分布在          5~15km/s。图    10(b) 中的  D-u  关系表明数据呈现出了较好的一致性:
               D=4.070(±0.300)+1.200(±0.035) u。数据的不确定评估采用文献             [22] 中的标准方法。同时,实验结果也
                                                 3
               可反映不同初始密度(4.05          和  4.50 g/cm )对应冲击   Hugoniot 数据的不同趋势,如图          10(a) 所示,红色、蓝
               色和绿色实线来自         WEOS  模型  [20]  的  TF  理论结果,分别对应     4.05、4.30  和  4.50 g/cm 的初始密度,红色、
                                                                                         3
               绿色散点为本文中获得的             2  种初始密度的铜粉实验数据,黑色和黄色散点来自文献                         [27-35] 的铜粉数
               据。图   10(b) 中黑色散点为密实铜的          Hugoniot 实验数据。从图中理论数据与实验数据、本文中得到的实

                      1 600                                      24

                           Experiment                              Experiment
                      1 400  This work (ρ 0 =4.05 g/cm 3 )           This work (ρ 0 =4.05 g/cm 3 )
                             This work (ρ 0 =4.50 g/cm 3 )       20  This work (ρ 0 =4.50 g/cm 3 )
                      1 200  References [28−35] (ρ 0 =3.70 g/cm 3 )  References [28−35] (ρ 0 =4.48 g/cm 3 )
                                                                     Reference [27] (ρ 0 =8.93 g/cm 3 )
                             References [28−35] (ρ 0 =4.48 g/cm 3 )  16 Theory (WEOS [20] )
                      1 000
                      Pressure/GPa  800  ρ 0 =4.05 g/cm 3       Shock velocity/(km·s −1 )  12  ρ 0 =4.05 g/cm 3
                           Theory (WEOS [20] )
                             ρ 0 =4.30 g/cm 3
                             ρ 0 =4.50 g/cm 3
                       600
                       400                                        8
                       200                                        4
                         0
                         −2  0  2   4  6  8  10  12  14  16  18   0    2   4   6   8   10  12  14  16
                                   Particle velocity/(km·s )               Particle velocity/(km·s )
                                                                                          −1
                                                 −1
                         (a) Pressure-particle velocity  relationship         (b) Shock velocity-particle velocity relationship
                              图 10    理论物态方程计算的压力-粒子速度/冲击波速度-粒子速度和实验数据的对比
                      Fig. 10    Comparison of p-u/D-u relationships calculated by theoretical equation of state with experimental data


                                                         074202-7

