Page 254 - 《爆炸与冲击》2026年第5期
P. 254

−2
                                                                 −4

                    第 46 卷             胡倩然,等: 基于人工神经网络的居民住宅燃气爆炸后果预测                                 第 5 期


                          p sim  p pre                                   x sim  y sim  z sim  x pre  y pre  z pre
                                                        100                                          100
                  2 700     Relative error              80       15      Maximum relative error      80
                 Maximum temperature/K  2 500           60  Relative error/%  Coordinate/m  10 5     60 Maximum relative error/%
                  2 600


                  2 400
                                                                                                     40
                                                        40
                  2 300
                  2 200                                 20       −5 0                           20%  20
                                                    5%
                  2 100                                 0                                            0
                         1  2  3  4  5  6  7  8  9  10                1  2  3  4  5  6  7  8  9  10
                              Number of the validation set                Number of the validation set
                         (c) Maximum temperature and relative error   (d) Coordinates and maximum relative error
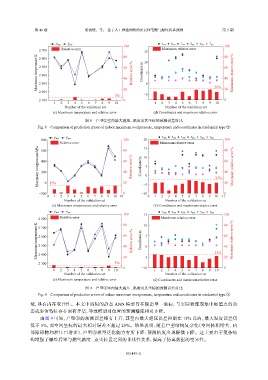
                                       图 8    户型②室内最大超压、温度及其坐标的预测误差对比
                  Fig. 8    Comparison of prediction errors of indoor maximum overpressure, temperature and coordinates in residential type ②

                   800   p sim  p pre                   100      20      x sim  y sim  z sim  x pre  y pre  z pre  100
                           Relative error               80       15     Maximum relative error       80
                  Maximum overpressure/kPa  400         60  Relative error/%  Coordinate/m  10 5 0  25%  60 Maximum relative error/%
                   600


                                                                                                     40
                                                        40
                   200
                                                                 −5

                                                        0
                  −200 0 15%                            20      −10                                  20
                                                                                                     0
                      0  1  2  3  4  5  6  7  8  9  10 11          0  1  2  3  4  5  6  7  8  9  10 11
                              Number of the validation set                Number of the validation set
                        (a) Maximum overpressure and relative error  (b) Coordinates and maximum relative error
                         p sim  p pre                                    x sim  y sim  z sim  x pre  y pre  z pre
                                                        100      15                                 100
                  2 800     Relative error              80       10     Maximum relative error      80
                 Maximum temperature/K  2 600           60  Relative error/%  Coordinate/m  5 0  25%  60 Maximum relative error/%
                  2 700


                  2 500
                                                        40
                                                                                                    40
                  2 400
                  2 300                             5%  20       −5                                 20
                         1  2  3  4  5  6  7  8  9  10  0       −10  1  2  3   4  5  6  7  8  9  10  0
                              Number of the validation set                Number of the validation set
                         (c) Maximum temperature and relative error  (d) Coordinates and maximum relative error
                                       图 9    户型③室内最大超压、温度及其坐标的预测误差对比
                  Fig. 9    Comparison of prediction errors of indoor maximum overpressure, temperature and coordinates in residential type ③

               域,具有内在变异性。本文中所用的静态                   ANN  模型旨在输出单一坐标,与实际物理现象中极值点的动
               态或多值特征存在固有矛盾,导致模型对位置的预测精度相对下降。
                   由图   9  可知,户型③的预测误差略有上升,其室内最大超压误差控制在                           15%  以内,最大温度误差仍
               低于  5%,而空间坐标的最大相对误差不超过                  25%。结果表明,随着户型结构复杂化(空间体积增大、内
               部障碍物和泄压口增多),户型③模型泛化能力有所下降,预测精度出现轻微下降。这主要由于复杂结
               构增强了爆炸后果与燃气浓度、点火位置之间的非线性关系,提高了仿真数据的变异性。


                                                         051445-11
   249   250   251   252   253   254   255   256   257   258   259