
Page 253 - 《爆炸与冲击》2026年第5期
P. 253
第 46 卷 胡倩然,等: 基于人工神经网络的居民住宅燃气爆炸后果预测 第 5 期
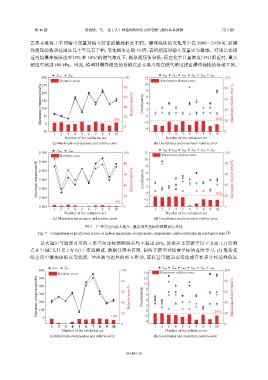
差异主要源于不同输出变量对输入特征的敏感程度不同。爆炸温度的变化集中在 2000~2 650 K,而爆
炸超压的波动范围从几十至几百千帕,变化幅度达数 10 倍,表明超压对输入变量更为敏感。特别是在接
近丙烷爆炸极限边界(2% 和 10%)的燃气浓度下,模拟超压值较低;而在化学计量浓度(4%)附近时,最大
超压可超过 600 kPa。因此,模型对爆炸超压的预测误差主要出现在燃气浓度接近爆炸极限的极端工况。
300 p sim p pre 100 12 x sim y sim z sim x pre y pre z pre 100
Relative error 80 10 8 Maximum relative error 80
250
Maximum overpressure/kPa 150 60 Relative error/% Coordinate/m 6 4 2 0 60 Maximum relative error/%
200
40
100
40
50
10%
0
0 20 −2 20% 20
−4
−50 0
1 2 3 4 5 6 7 8 9 10 1 2 3 4 5 6 7 8 9 10
Number of the validation set Number of the validation set
(a) Maximum overpressure and relative error (b) Coordinates and maximum relative error
x sim y sim z sim x pre y pre z pre
p sim
p pre
2 700 100 12 100
Relative error Maximum relative error
10 8 80
2 600
80
Maximum temperature/K 2 500 60 Relative error/% Coordinate/m 6 4 2 60 Maximum relative error/%
2 400
40
40
2 300
2 200
5% 20 −2 0 20% 20
2 100 0 −4 0
1 2 3 4 5 6 7 8 9 10 1 2 3 4 5 6 7 8 9 10
Number of the validation set Number of the validation set
(c) Maximum temperature and relative error (d) Coordinates and maximum relative error
图 7 户型①室内最大超压、温度及其坐标的预测误差对比
Fig. 7 Comparison of prediction errors of indoor maximum overpressure, temperature and coordinates in residential type ①
最大超压与温度对应的三维空间坐标预测误差均不超过 20%,该误差主要源于以下方面:(1) 监测
点在空间(尤其是 z 方向)上布设稀疏,数据分辨率有限,制约了模型对位置坐标的连续学习;(2) 复杂受
限空间中爆炸极值点受湍流、冲击波与边界的相互作用,其位置可能动态变化或存在多个相近峰值区
p sim p pre x sim y sim z sim x pre y pre z pre
600 100 100
Relative error 80 14 Maximum relative error 80
Maximum overpressure/kPa 400 60 Relative error/% Coordinate/m 8 6 4 2 60 Maximum relative error/%
500
12
10
300
200
40
40
100
0 10% 20 −2 0 20% 20
−4
0 0
1 2 3 4 5 6 7 8 9 10 1 2 3 4 5 6 7 8 9 10
Number of the validation set Number of the validation set
(a) Maximum overpressure and relative error (b) Coordinates and maximum relative error
051445-10
−5