Page 156 - 《爆炸与冲击》2026年第5期
P. 156

第 46 卷         潘刘娟,等: 图学习驱动的爆炸冲击钢筋混凝土柱结构响应的建模与预测                                第 5 期

                                                         3D view
                                    Front view                                 Side view


                             850 mm  740 mm  870 mm  610 mm            570 mm    720 mm  600 mm  750 mm


                            70 mm 190 mm  50 mm 220 mm
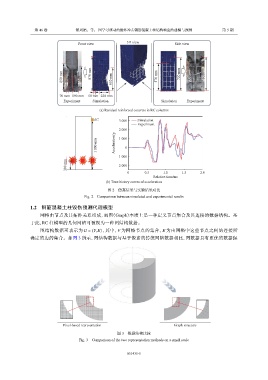
                             Experiment   Simulation                     Simulation  Experiment

                                             (a) Residual reinforced concrete in RC columns
                                           AC         3 000   Simulation
                                                              Experiment
                                                      2 000

                                            1 800 mm  Acceleration/g  1 000 0


                                                     −1 000
                              300 mm                 −2 000

                                                          0      0.5     1.0      1.5     2.0
                                                                     Relative time/ms
                                                (b) Time history curves of acceleration
                                                 图 2    仿真结果与实验结果对比
                                      Fig. 2    Comparison between simulated and experimental results

                1.2    钢筋混凝土柱毁伤预测代理模型
                   网格由节点及其拓扑关系组成,而图(Graph)本质上是一种定义节点集合及其连接的数据结构。基
               于此,RC   柱模型的几何网格可被视为一种图结构数据。
                                                                         E  为由网格中这些节点之间的连接所
                   图结构数据可表示为          G = (V,E)  ,其中,   V  为网格节点的集合,
               确定的边的集合。如图           3  所示,图结构数据与基于像素的传统网格数据相比,图数据具有更优的数据保


                             Pixel-based representation                       Graph structure

                                                     图 3    数据结构比较
                                    Fig. 3    Comparison of the two representation methods on a small scale


                                                         051435-5
   151   152   153   154   155   156   157   158   159   160   161