
Page 171 - 《爆炸与冲击》2026年第4期
P. 171
−500 −20
−500 −20
第 46 卷 吴 昊,等: 落石冲击框架T梁式RC棚洞损伤破坏评估 第 4 期
Effective plastic
Test Simulation Test Simulation strain
1.0
438 mm 453 mm 0.9
0.8
463 mm 528 mm 814 mm 771 mm 0.7
0.6
0.5
0.4
446 mm 425 mm 645 mm 692 mm 0.3
0.2
Top Bottom 0.1
0
(d) Slab damage
图 5 冲击试验 [22] 与数值模拟结果对比
[22]
Fig. 5 Comparisons of impact test and simulated results
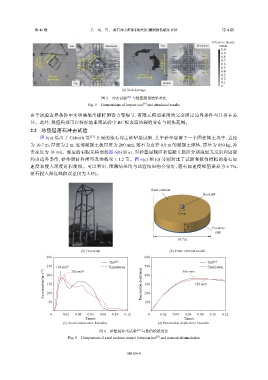
在于试验边界条件中未明确给出螺杆预紧力等细节,有限元模型采用的完全固定边界条件与其存在差
异。此外,数值模拟可以较好地重现试验中 RC 板表面的裂缝分布与损伤范围。
2.2 砂垫层落石冲击试验
图 6(a) 给出了 Calvetti 等 [23] 开展的落石冲击砂垫层试验,其中砂垫层置于一个圆柱体土坑中,直径
为 10.7 m,厚度为 2 m,底部混凝土板厚度为 200 mm,落石为直径 0.9 m 的混凝土球体,质量为 850 kg,冲
击速度为 10 m/s。相应的有限元模型如图 6(b) 所示,对砂垫层侧面和混凝土底面分别施加无反射和固定
约束边界条件,砂垫层材料模型及参数见 1.1.2 节。图 6(c) 和 (d) 分别对比了试验和数值模拟的落石加
速度和侵入深度时程曲线。可以看出,预测结果均与试验结果吻合很好,落石加速度峰值误差为 6.7%,
落石侵入深度峰值误差仅为 2.8%。
Sand cushion
Rockfall
0.9 m
2 m Concrete
slab
10.7 m
(a) Test setup (b) Finite element model
300 600
Test [23] Test [23]
250 189 m/s 2 202 m/s 2 Simulation 500 366 mm Simulation
Acceleration/(m·s −2 ) 150 Penetration depth/mm 300 358 mm
400
200
100
200
50 100
0 0.02 0.04 0.06 0.08 0.10 0.12 0 0.02 0.04 0.06 0.08 0.10 0.12
Time/s Time/s
(c) Acceleration-time histories (d) Penetration depth-time histories
图 6 砂垫层冲击试验 [23] 与数值模拟对比
[23]
Fig. 6 Comparison of sand cushion impact between test and numerical simulation
045104-8