
Page 94 - 《爆炸与冲击》2026年第2期
P. 94
第 46 卷 彭江舟,等: 城市建筑外爆威力场与毁伤效应数智仿真模型及应用 第 2 期
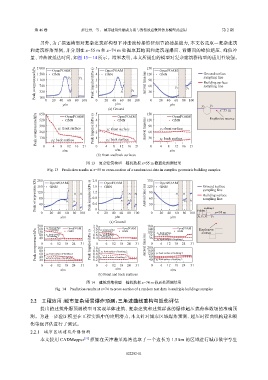
另外,为了描述模型对复杂建筑群构型下冲击波传播特征细节的捕捉能力,本文各选取一复杂建筑
和建筑群落案例,并分别在 x=55 m 和 x=74 m 处提取其地面和建筑迎爆面、背爆面的峰值超压、峰值冲
量、冲击波抵达时间,如图 13~14 所示。结果表明,本文所提出的模型对复杂建筑群构型的适用性较强。
2 000 OpenFOAM 5 4 OpenFOAM 150 OpenFOAM Ground surface
Peak overpressure/kPa 1 160 y 1 y 2 Peak impulse/(kPa·s) 3 2 1 y 1 y 2 Arrival time/ms 90 y 1 y 2 sampling line
1 580
120
GNN
GNN
GNN
Building surface
740
sampling line
60
320
30
−100
40
20
0
y/m 60 80 100 0 20 40 y/m 60 80 100 0 20 40 y/m 60 80 100 y 1
(a) Ground 150 OpenFOAM y 2 Explosive source
x=55 m
5
650
Peak overpressure/kPa 520 y 2 : back surface Peak impulse/(kPa·s) 4 3 2 1 y 2 : back surface Arrival time/ms 120 y 2 : back surface
OpenFOAM
OpenFOAM
GNN
GNN
GNN
390
90
y 1 : front surface
y 1 : front surface
y 1 : front surface
260
60
130
30
4
0
8
z/m 12 16 21 0 4 8 z/m 12 16 21 0 4 8 z/m 12 16 21
(b) Front and back surfaces
图 13 复杂建筑构型一随机数据 x=55 m 截面处预测结果
Fig. 13 Prediction results at x=55 m cross-section of a random test data in complex geometric building samples
200 OpenFOAM 2.0 OpenFOAM 150 OpenFOAM Ground surface
Peak overpressure/kPa 120 y 1 y 2 y 3 y 4 Peak impulse/(kPa·s) 1.2 y 1 y 2 y 3 y 4 Arrival time/ms 90 y 1 y 2 y 3 y 4 sampling line
1.6
120
160
GNN
GNN
GNN
Building surface
0.8
60
80
sampling line
0.4
40
30
Building 2
0 20 40 60 80 100 0 0 20 40 60 80 100 0 20 40 60 80 100 Building 1 x=74 m
y/m y/m y/m y 4 y 3 y 2 y 1
(a) Ground
200 y 2: back surface OpenFOAM 2.0 y 2: back surface OpenFOAM 180 y 1: back surface OpenFOAM Explosive
y 1: front surface
160
144
y 1: front surface
of building 1
Peak overpressure/kPa 100 0 y 3: front surface of building 2 24 31 Peak impulse/(kPa·s) 1.6 0 y 3: front surface of building 2 24 31 Arrival time/ms 108 0 y 3: back surface of building 2 24 31
GNN
GNN
1.2
GNN
120
of building 1
source
80
72
0.8
of building 1
of building 1
of building 1
0.4
36
40
y 2: front surface of building 1
18
12
6
12
6
12
18
6
18
200
1.0
160
80
0.8
120
0.6
60
40
40
0.2
20
6
12
0 y 4: back surface of building 2 24 31 0.4 0 y 4: back surface of building 2 24 31 80 0 y 4: front surface of building 2 24 31
12
6
12
18
18
6
18
z/m z/m z/m
(b) Front and back surfaces
图 14 建筑群落构型一随机数据 x=74 m 截面处预测结果
Fig. 14 Prediction results at x=74 m cross-section of a random test data in multiple buildings samples
2.2 工程应用:城市复杂场景爆炸预测、三角波曲线重构与毁伤评估
提出的建筑外爆预测模型可实现单体建筑、复杂建筑和建筑群落的爆炸超压载荷参数场的准确预
测。为进一步验证模型在工程实践中的应用潜力,本文针对城市区域爆炸预测、超压时程曲线构建和毁
伤等级评估进行了测试。
2.2.1 城市区域建筑外爆预测
本文使用 CADMapper [31] 框架在天津港某海湾选取了一个边长为 1.5 km 的区域进行城市数字孪生
022202-11