Page 224 - 《水产学报》2026年第04期
P. 224

4 期                                     水    产    学    报                                 50 卷

               2.3    稀有种对群落的影响                                下降了    6.90%,2024  年春季下降了       7.90%,2024
                                                               年秋季下降了       3.10%,2025  年春季下降了       9.00%。
                   通过对比移除稀有种前后生物量、群落稳定
                                                                   群落稳定性方面,稀有种移除后各季节群落
              性、功能空间和功能冗余的变化,发现稀有种对
                                                               稳定性指数呈整体上升,其中,除                  2025  年春季
              舟山渔场鱼类群落的稳定性与功能特征具有显著
                                                               存在显著变化外        (P < 0.05),其余季节均不显著
              影响   (图  3,图  4,图   5)。在生物量方面,稀有种                (图  3-b)。 2025  年 春 季 群 落 平 均 稳 定 性 指 数 由

              移除后群落平均总生物量在各季节均出现不同程                            0.66±0.23  上升至  0.71±0.27(提高约   8.20%);2023
              度的下降     (图  3-a)。其中,2023   年秋季群落生物量             年秋季、2024    年春季和秋季,稳定性变化波动幅


                        2.0                                        150
                                                  ns.
                                              ns.                                             ns.
                                          ns.                                             ns
                                          ns.                                         ns.
                                       ns.                                            **
                        1.5        ns.            P=0.969          100        ***  *         P<0.001
                    稳定性 (ICV)  stability  1.0                   生物量 (B)/kg  biomass  50


                        0.5
                                                                     0
                               1       2      3       4                    1      2       3      4
                                         季节                                          季节
                                        season                                      season
                                          (a)                                        (b)
                                                                                              ns.
                        35                                         150                    *
                                                  *                                   **
                                              *                    100         ns.  ****  ***  P<0.001
                                          ns.
                                           *
                                       ns.
                     功能冗余 (FR) functional redundancy 30  P=0.035  功能空间 (FS)  functional space  50
                                   ns.
                        25
                        20
                        15


                        10
                                                                     0
                               1       2      3       4                    1      2       3      4
                                         季节                                          季节
                                        season                                      season
                                          (c)                                        (d)
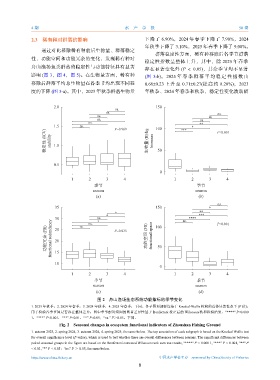
                                          图 2    舟山渔场生态系统功能指标的季节变化
              1. 2023  年秋季,2. 2024  年春季,3. 2024  年秋季,4. 2025  年春季,下同。各子图顶部标注基于  Kruskal-Wallis 检验的总体显著性水平  (P  值),
              用于检验各季节间是否存在整体差异;图中季节配对组间的显著差异性基于                   Bonferroni 校正后的  Wilcoxon  秩和检验结果,“****” P<0.000
              1,“***” P<0.001,“**” P<0.01,“*” P<0.05;“ns.” P>0.05,下同。
                          Fig. 2 Seasonal changes in ecosystem functional indicators of Zhoushan Fishing Ground
              1. autumn 2023, 2. spring 2024, 3. autumn 2024, 4. spring 2025, the same below. The top annotation of each subgraph is based on the Kruskal Wallis test
              for overall significance level (P-value), which is used to test whether there are overall differences between seasons. The significant differences between
              paired seasonal groups in the figure are based on the Bonferroni corrected Wilcoxon rank sum test results, "****" P < 0.000 1, "***" P < 0.001, "**" P
              < 0.01, "*" P < 0.05;"ns." P > 0.05, the same below.

              https://www.china-fishery.cn                           中国水产学会主办    sponsored by China Society of Fisheries
                                                            8
   219   220   221   222   223   224   225   226   227   228   229