Page 185 - 《水产学报》2026年第04期
P. 185

4 期                李金寒,等:山东半岛南部近岸海域鱼类群落结构及群落功能多样性                                        50 卷


                                             表 2    山东半岛南部近岸海域优势种         IRI
                         Tab. 2    IRI of dominant species in the southern offshore waters of the Shandong Peninsula
                            种类                     春季             夏季              秋季             冬季
                           species                spring         summer          autumn          winter
                   方氏云鳚 E. fangi                  3 692.9*       1 230.8*          62.4           256.4
                   矛尾虾虎鱼 C. stigmatias            2 434.5*         12.8            25.0           113.9
                   细纹狮子鱼 L. tanakae               2 056.7*        418.8                           24.8
                   角木叶鲽 P. cornutus               1 695.9*        371.2           214.0           284.8
                   大泷六线鱼 H. otakii                1 418.5*        395.1            2.3
                   绿鳍鱼 C. kumu                                   1 174.2*        3 044.4*         288.1
                   赤鼻棱鳀 T. kammalensis             213.6         1 147.4*        1 477.3*         451.9
                   细条天竺鲷 A. lineatus               128.2          968.0          3 502.9*         818.5
                   长蛇鲻 S. elongata                                               2 279.8*         216.0
                   尖海龙 S. acus                      11.6            0.4            60.6         4 286.5*
                   六丝钝尾虾虎鱼 A. hexanema              5.9            12.8           400.4         1 501.3*
              注:表中*为对应季节的优势种。
              Notes: the asterisk (*) denotes the dominant species for each season.

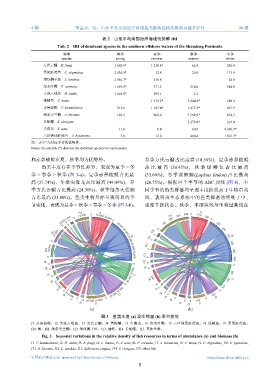
              和赤鼻棱鳀在夏、秋季均为优势种。                                 春季方氏云鳚占比最高           (18.58%),夏季赤鼻棱鳀
                   鱼类丰度存在季节性差异,表现为夏季 > 冬                       占 比 最 高    (20.45%), 秋 季 绿 鳍 鱼 占 比 最 高
              季 > 春季 > 秋季     (图  3-a)。夏季赤鼻棱鳀占比最               (33.60%),冬季黄鮟鱇(Lophius litulon) 占比最高
              高  (27.74%),冬季尖海龙占比最高            (44.09%),春      (26.75%)。根据四个季节的         ABC  曲线  (图  4),不
              季方氏云鳚占比最高           (24.50%),秋季细条天竺鲷             同季节的鱼类群落均呈现丰度曲线高于生物量曲
              占比最高     (33.00%)。鱼类生物量亦呈现明显的季                   线,表明该生态系统中的鱼类群落始终处于中、
              节变化,表现为夏季 > 秋季 > 春季 > 冬季             (图  3-b)。   重度干扰状态。秋季,丰度曲线与生物量曲线在

                                  f15   0  A                             f15  300  400  0  100 A
                                  1 0 000
                           f12 f13 f14 0  0  10 000 20 000 0             200            200 0
                             0
                            0                                         100                    100
                                                                    0                          200
                       f11 10 000                                 f14
                                                                f13  0                            300  B
                                                         B
                       0                           10 000 20 000 30 00040 000 50 000  0            400
                      10 000                                   f12
                     f10                                        0                                   500
                                                               f11
                      0                                        0
                                                                                                     600
                    f9
                                                          0   f10  0
                                                                                                     0
                     0
                                                         10 000  C  0                               100
                                                              f9
                    f8
                      0
                                                       20 000   f8  100                           200  C
                     f7
                       0
                        0
                      f6
                                                      0            0  0                         300
                                                20 000 10 000        f6  0
                         10 000
                         f5
                            0                                      f7                          0
                            f4  010 000             D                  f5 0                100
                                  0           0                            0            0    D
                               f3   0  20 000  10 000                    f4    0  0  100
                                   f2                                        f3       f1
                                         f1                                      f2
                                       (a)                                       (b)
                                            图 3    鱼类丰度 (a) 及生物量 (b) 季节变化
              f1. 赤鼻棱鳀,f2. 大泷六线鱼,f3. 方氏云鳚,f4. 黄鮟鱇,f5. 尖海龙,f6. 角木叶鲽,f7. 六丝钝尾虾虎鱼,f8. 绿鳍鱼,f9. 矛尾虾虎鱼,
              f10. 鳀,f11. 细条天竺鲷,f12. 细纹狮子鱼,f13. 油魣,f14. 长蛇鲻,f15. 其他鱼类。
                   Fig. 3 Seasonal variations in the relative density of fish resources in terms of abundance (a) and biomass (b)
              f1. T. kammalensis, f2. H. otakii, f3. E. fangi, f4. L. litulon, f5. S. acus, f6. P. cornutus, f7. A. hexanema, f8. C. kumu, f9. C. stigmatias, f10. E. japonicus,
              f11. A. lineatus, f12. L. tanakae, f13. Sphyraena pinguis, f14. S. elongate, f15. other fish.
              中国水产学会主办  sponsored by China Society of Fisheries                          https://www.china-fishery.cn
                                                            5
   180   181   182   183   184   185   186   187   188   189   190