


Page 209 - 《高原气象》2026年第5期
P. 209
5 期                       杨耀先等:西北干旱半干旱区夏季极端降水的时空特征                                         1425
              (e)], 且两类极端降水异常场的空间相关系数为                           节对每一类极端降水对应的对流层中高层大尺度
               -0. 52, 通过 99% 显著性检验。这说明, 2类极端降                   大气环流、 垂直速度及水汽输送异常特征开展
               水之间存在着一定的联系, 这种联系很可能和与之                           分析。

               相关联的大气环流异常有关。                                         通过极端降水日聚类合成的 3 类极端降水对
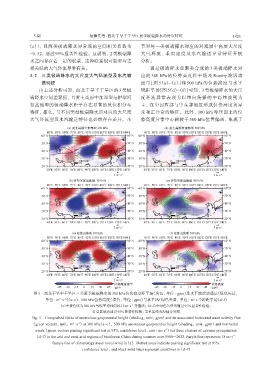
               3. 2 三类极端降水的大尺度大气环流型及水汽输                          应的 300 hPa 的位势高度距平场及 Rossby 波活动
                    送特征                                          通量[图 5(a)~(c)]和 500 hPa 的位势高度与水平
                   由上述分析可知, 西北干旱半干旱区的 3 类极                       风距平场[图 5(d)~(f)]可知, 3 类极端降水的大尺
               端降水空间差异强, 且黄土高原中东部型与伊犁河                           度环流异常表现为以纬向传播的中高纬波列为
               谷盆地型的极端降水距平存在显著的反位相分布                             主, 在中国西部与中东部地区形成位势高度负异
               特征, 那么, 与不同类型极端降水所对应的大尺度                          常和正异常的特征。此外, 300 hPa 等压面上的位
               大气环流型及水汽输送特征也必然存在差异。本                             势高度异常中心相较于 500 hPa 位置偏西, 出现了


                图5 西北干旱半干旱区三类夏季极端降水的300 hPa位势高度距平场(填色, 单位: gpm)及水平波活动通量(绿色矢量,
                                                                                           -1
                            2
                              -2
                      单位: m·s )(a~c), 500 hPa位势高度(填色, 单位: gpm)与水平风(绿色矢量, 单位: m·s )的距平场(d~f)
                                                             -1
                            (a)中紫色线为300 hPa气候平均纬向风18 m·s  等值线; (d~f)中绿色矢量均通过95%显著性检验;
                                           打点区域为通过95%显著性检验; 黑色实线为海陆分界线
               Fig. 5 Composited fields of anomalous geopotential height (shading, unit: gpm) and its associated horizontal wave activity flux
                                    -2
                                  2
                (green vectors, unit: m·s ) at 300 hPa(a~c), 500 hPa anomalous geopotential height (shading, unit: gpm) and horizontal
                                                                            -1
                 winds (green vectors passing significant test at 95% confidence level, unit: m·s ) for three clusters of extreme precipitation
                                                                                                           -1
                 (d~f) in the arid and semi-arid regions of Northwest China during summer over 1980 -2022. Purple line represents 18 m·s
                         feature line of climatology mean zonal wind in (a).  Dotted areas indicate passing significant test at 95%
                                      confidence level, and black solid lines represent coastlines in (d~f)

