


Page 170 - 《高原气象》2026年第5期
P. 170
高     原      气     象                                 45 卷
              1386


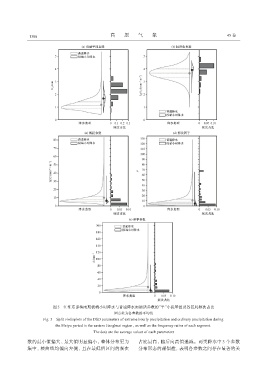
                         图5 江淮东部梅雨期极端小时降水与普通降水雨滴谱参数的“半”小提琴图及各区间频次占比
                                                     圆点处为各参数的平均值
                     Fig. 5 Split violinplots of the DSD parameters of extreme hourly precipitation and ordinary precipitation during
                          the Meiyu period in the eastern Jianghuai region, as well as the frequency ratios of each segment.
                                           The dots are the average values of each parameters

             数的最小值偏大、 最大值明显偏小, 整体分布更为                           占比最高, 随后向高值递减。两类降水中 3 个参数
             集中, 核曲线均偏向左侧, 且在最低值区间的频次                           分布形态的相似性, 表明各参数之间存在显著的关

