


Page 42 - 《高原气象》2026年第4期
P. 42
高     原      气     象                                 45 卷
              972


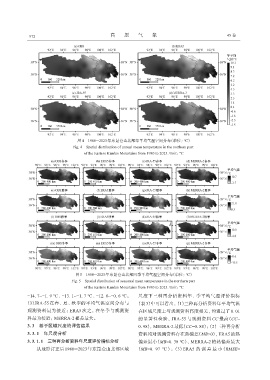
                                    图4 1980 -2023年东昆仑山北部年平均气温空间分布(单位: ℃)
                                  Fig. 4 Spatial distribution of annual mean temperature in the northern part
                                       of the Eastern Kunlun Mountains from 1980 to 2023. Unit: ℃


                                   图5 1980 -2023年东昆仑山北部四季平均气温空间分布(单位: ℃)
                                 Fig. 5 Spatial distribution of seasonal mean temperature in the northern part
                                       of the Eastern Kunlun Mountains from 1980 to 2023. Unit: ℃

             -14. 7~-1. 9 ℃、 -13. 1~-1. 7 ℃、 -12. 0~-0. 6 ℃。    尺度下三种再分析资料年、 季平均气温评价指标
             (3)JRA-55 在春、 夏、 秋季的平均气温空间分布与                     (表 3)中可以看出, (1)三种再分析资料年平均气温
             观测资料最为接近; ERA5 次之, 在冬季与观测资                         在区域尺度上与观测资料高度相关, 均通过了 0. 01
             料最为接近; MERRA-2相差最大。                                的显著性检验, JRA-55 与观测资料 CC 最高(CC=
             3. 3 基于区域尺度的评估结果                                   0. 98), MERRA-2最低(CC=0. 88); (2)三种再分析

             3. 3. 1 年尺度分析                                      资料均对观测资料存在热偏差(MB>0), ERA5的热
             3. 3. 1. 1 三种再分析资料年尺度评价指标分析                        偏差最小(MB=0. 38 ℃), MERRA-2 的热偏差最大
                  从地形订正后1980 -2023年东昆仑山北部区域                    (MB=0.  97  ℃); (3)ERA5 的 误 差 最 小(RMSE=

