


Page 161 - 《高原气象》2026年第4期
P. 161
4 期          陈笑笑等:1961 -2022年长江流域干旱热浪复合事件与其单一事件的特征差异及成因分析                                  1091


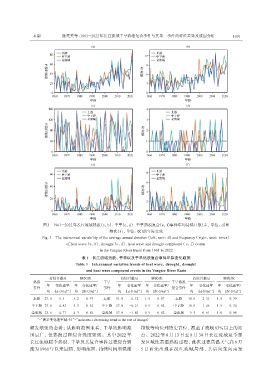
                     图3 1961 -2022年长江流域热浪(a, b)、 干旱(c, d)、 干旱热浪复合(e, f)事件年均持续日数(左, 单位: d)和
                                                   频次(右, 单位: 次)的年际变化
                    Fig. 3 The interannual variability of the average annual duration (left, unit: d) and frequency ( right, unit: times)
                               of heat wave (a, b), drought (c, d), heat wave and drought compound ( e, f) events
                                              in the Yangtze River Basin from 1961 to 2022
                                      表1  长江流域热浪、 干旱以及干旱热浪复合事件年际变化趋势
                                   Table 1  Interannual variation trends of heat wave, drought, drought
                                        and heat wave compound events in the Yangtze River Basin
                       持续日数/d        频次/次               持续日数/d        频次/次              持续日数/d        频次/次
                热浪                              干旱                             干旱热浪
                      年   变化速率     年  变化速率/           年    变化速率    年   变化速率/           年   变化速率     年  变化速率/
                事件                              事件                             复合事件
                                            -1
                                                                                                             -1
                                                                                                -1
                                                                            -1
                                                                -1
                      均   / [d·(10a)] 均 [次·(10a)]     均   / [d·(10a)] 均 [次·(10a)]      均   / [d·(10a)] 均 [次·(10a)]
                               -1
                上游   27. 0  5. 5  5. 2  0. 97   上游    51. 0  6. 12  1. 0  0. 07  上游   10. 0  2. 31  1. 8  0. 39
               中下游 27. 8    4. 82  5. 3  0. 52  中下游   57. 0  -0. 21  0. 9  0. 02  中下游  10. 0  1. 46  1. 9  0. 34
               全流域 23. 6    4. 77  4. 3  0. 88  全流域   57. 0  -1. 42  0. 9  0. 02  全流域  5. 5  0. 61  1. 0  0. 08
                 “-”表示变化速率减小(“-”indicates a decreasing trend in the rate of change)
               频发增强的态势; 从影响范围来看, 干旱的影响范                          指数等均位列历史首位, 覆盖了流域 83% 以上的站
               围最广, 但热浪过程综合强度更强。其中 2022 年                        点。2022 年 6 月 13 日至 8 月 30 日长江流域夏季暴
               长江流域暖季热浪、 干旱及其复合事件过程综合强                           发区域性高温热浪过程, 此次过程高温天气自 6 月
               度为 1961年以来最强, 影响范围、 持续时间和强度                       5 日首先出现在汉江流域局部, 其后向东向南发

