


Page 36 - 《高原气象》2026年第3期
P. 36
高     原      气     象                                 45 卷
              644


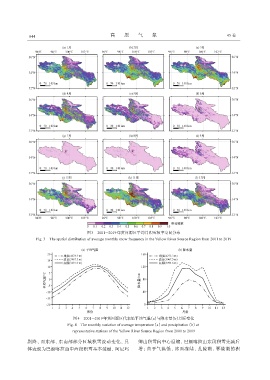
                                        图3 2001 -2019年黄河源区平均月积雪频率空间分布
                 Fig. 3 The spatial distribution of average monthly snow frequency in the Yellow River Source Region from 2001 to 2019


                                  图4 2001 -2019年黄河源区代表站平均气温(a)与降水量(b)月际变化
                                Fig. 4 The monthly variation of average temperature (a) and precipitation (b) at
                                  representative stations of the Yellow River Source Region from 2001 to 2019

             剧降, 而东部、 东南部部分区域积雪波动变化, 具                          卿山积雪向中心退缩, 巴颜喀拉山东段积雪先减后
             体表现为巴颜喀拉山中西段积雪基本消融, 阿尼玛                            增; 由于气温低, 冰面冻结, 扎陵湖、 鄂陵湖的积

