


Page 254 - 《高原气象》2026年第3期
P. 254
高     原      气     象                                 45 卷
              862


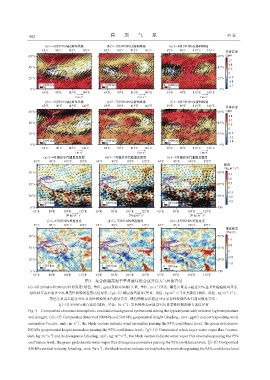
                                        图3 复合极端高温干旱典型年份合成异常大气环流背景
                                                                        -1
             (a)~(f) 200 hPa和500 hPa位势高度(填色, 单位: gpm)及相应风场(矢量, 单位: m·s )异常, 黑色矢量表示超过95%显著性检验的风异常,
                                                                                  -1
                                                                                                       -2
                                                                                                          -1
                                                                                -1
              绿色圆点表示通过95%显著性检验的位势高度异常; (g)~(i) 整层水汽通量(矢量, 单位: kg·m ·s )及其散度(填色, 单位: kg·m ·s ),
                        黑色矢量表示超过95%显著性检验的水汽通量异常, 绿色网格表示通过95%显著性检验的水汽通量散度异常;
                                                         -1
                           (j)~(l) 850 hPa垂直速度(填色, 单位: Pa·s ), 黑色网格表示通过95%显著性检验的垂直速度异常
              Fig. 3 Composited abnormal atmospheric circulation background synthesized during the typical years with extreme high temperature
              and drought.(a)~(f) Composited abnormal 200 hPa and 500 hPa geopotential height (shading, unit: gpm) and corresponding wind
              anomalies (vector, unit: m·s ), the black vectors indicate wind anomalies passing the 95% confidence level, the green dots denote
                                   -1
              200 hPa geopotential height anomalies passing the 95% confidence level; (g)~(i) Composited whole layer water vapor flux (vector,
                                                         -1
                     -1
              unit: kg·m ·s ) and its divergence (shading, unit: kg·m ·s ), the black vectors indicate water vapor flux anomalies passing the 95%
                        -1
                                                      -2
              confidence level, the green grids denote water vapor flux divergence anomalies passing the 95% confidence level; (j)~(l) Composited
                                              -1
              850 hPa vertical velocity (shading, unit: Pa·s ), the black vectors indicate vertical velocity anomalies passing the 95% confidence level

