


Page 226 - 《高原气象》2026年第3期
P. 226
高     原      气     象                                 45 卷
              834
                                 表10  12区(市)g~l情景下人造地表1级危险区相对人造地表面积的比例
                      Table 10  Proportions and top two of the 1st level hazard in the 12 counties classified by artificial land
                         surfaces under the scenarios g~l compared with the whole artificial land surfaces in the county
                                                                   等权重/%
                情景       排序            PmR                 TpR               Pm×TpR               OtherR
                                 2010年     2020年     2010年     2020年     2010年     2020年    2010年     2020年
                 g        1       天宁        梁溪        天宁        梁溪       天宁        梁溪        天宁        梁溪
                                 0. 67     0. 67      0. 58    0. 50     0. 47     0. 40     0. 65     0. 65
                          2       梁溪        天宁       张家港        天宁       张家港       天宁        梁溪        天宁
                                 0. 62     0. 61      0. 48    0. 41     0. 42     0. 36     0. 63     0. 59
                 h        1       天宁        梁溪        天宁        梁溪       天宁        梁溪        天宁        梁溪
                                 0. 66     0. 68      0. 58    0. 45     0. 46     0. 37     0. 65     0. 67
                          2       梁溪        天宁       张家港        天宁       张家港       天宁        梁溪        天宁
                                 0. 64     0. 64      0. 44    0. 39     0. 36     0. 35     0. 64     0. 57
                  i       1       梁溪        梁溪        天宁        梁溪       天宁        梁溪        梁溪        梁溪
                                 0. 622    0. 64      0. 57    0. 51     0. 43     0. 39     0. 64     0. 65
                          2       天宁        天宁        梁溪        天宁       梁溪        天宁        天宁        天宁
                                 0. 616    0. 60      0. 45    0. 38     0. 40     0. 34     0. 60     0. 57
                  j       1      张家港       张家港       张家港        梁溪       张家港       梁溪        张家港       梁溪
                                 0. 25     0. 173     0. 19    0. 14     0. 15     0. 13     0. 22     0. 18
                          2       梁溪        梁溪        梁溪       张家港       梁溪        张家港       梁溪       张家港
                                 0. 17     0. 166     0. 14    0. 13     0. 13     0. 11     0. 18     0. 15
                 k        1      张家港       张家港       张家港        梁溪       张家港       梁溪        张家港       梁溪
                                 0. 23     0. 164     0. 18    0. 14     0. 14     0. 12     0. 20     0. 16
                          2       锡山        天宁        梁溪       张家港       梁溪        张家港       梁溪       张家港
                                 0. 15     0. 162     0. 13    0. 12     0. 12     0. 097    0. 16     0. 14
                  l       1      张家港        天宁        梁溪        梁溪       梁溪        梁溪        梁溪        梁溪
                                 0. 16     0. 16      0. 12    0. 13     0. 12     0. 11     0. 16     0. 15
                          2       梁溪        梁溪       张家港       张家港       张家港       张家港       张家港       天宁
                                 0. 13     0. 14      0. 11    0. 069    0. 091    0. 058    0. 13     0. 11

                                                                和土地利用类型是控制淹没结果的主要因子, 致洪
                                                                降水类型、 权重和排涝强度是影响危险性分区的重
                                                                要因素。

                                                                参考文献(References):

                                                                Berndtsson R, Becker P, Persson A, et al, 2019. Drivers of changing
                                                                   urban flood risk: a framework for action[J]. Journal of Environ‐
                                                                   mental Management, 240: 47-56.
                                                                Chen W H, Cui H J, Zwiers F W, et al, 2024. Detection and attribu‐
                                                                   tion of changes in precipitation extremes in China and its different
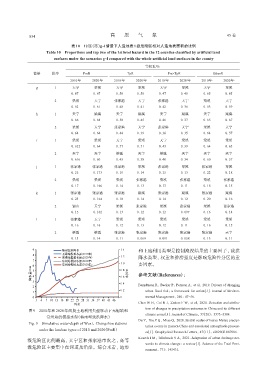
              图9 2010年和2020年两期土地利用类型驱动下无锡站和
                                                                   climate zones[J]. Journal of Climate, 37(20): 5373-5384.
                      常州站的模拟水深(梅雨型致洪降水)
                                                                Du Y, Xie Z Q, Miao Q, 2020. Spatial scales of heavy Meiyu precipi‐
              Fig. 9 Simulative water-depth of Wuxi, Changzhou stations
                                                                   tation events in Eastern China and associated atmospheric process‐
                   under the landuse types of 2010 and 2020(PmR)
                                                                   es[J]. Geophysical Research Letters, 47(11): e2020GL087086.
                                                                Kourtis I M, Tsihrintzis V A, 2021. Adaptation of urban drainage net‐
             级危险区比例最高, 天宁区和张家港市次之, 高等
                                                                   works to climate change: a review[J]. Science of the Total Envi‐
             级危险区主要集中在河道及沿岸。综合来看, 地形
                                                                   ronment, 771: 145431.

