


Page 200 - 《高原气象》2026年第3期
P. 200
高     原      气     象                                 45 卷
              808


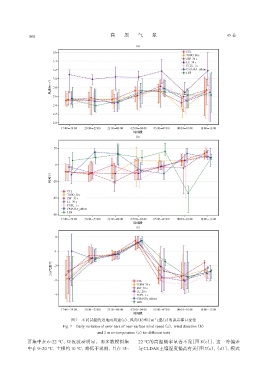
                                 图7 不同试验的近地面风速(a)、 风向(b)和2 m气温(c)的误差棒日变化
                             Fig. 7 Daily variation of error bars of near-surface wind speed (a), wind direction (b)
                                             and 2 m air temperature (c) for different tests

             要集中在 6~22 ℃, 昼夜波动明显。而多数模拟集                         22 ℃的高温概率显著不足[图 8(c)], 这一冷偏差
             中在 9~20 ℃, 主峰约 10 ℃, 略低于观测, 且在 15~                 与 CLDAS 土壤湿度偏高有关[图 3(c), (d)], 模式

