
Page 210 - 《高原气象》2026年第2期
P. 210
高 原 气 象 45 卷
510
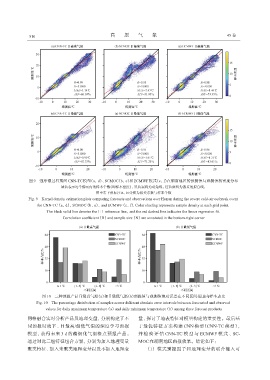
图9 强寒潮过程期间CNN-TC模型(a, d)、 SCMOC(b, e)和ECMWF模式(c, f)在湖南地区的预测值与观测值核密度分布
填色表示每个像元内的样本个数(即样本密度), 黑色实线为对角线, 红色虚线为散点的拟合线,
图中右下角标注R、 N分别为相关系数与样本个数
Fig. 9 Kernel density estimation plots comparing forecasts and observations over Hunan during the severe cold-air outbreak event
for CNN-TC (a, d), SCMOC (b, e), and ECMWF (c, f). Color shading represents sample density at each grid point.
The black solid line denotes the 1∶1 reference line, and the red dashed line indicates the linear regression fit.
Correlation coefficient (R) and sample size (N) are annotated in the bottom-right corner
图10 三种预报产品日最高气温(a)和日最低气温(b)预报值与观测值绝对误差在不同区间范围内样本占比
Fig. 10 The percentage distribution of samples across different absolute error intervals between forecasted and observed
values for daily maximum temperature (a) and daily minimum temperature (b) among three forecast products
网格融合实时分析产品及地理变量, 分别构建了不 量, 探讨了地表特征对模型构建的重要性。最后基
同预报时效下、 日最高/最低气温的深度学习预报 于最优特征方案构建 CNN 模型(CNN-TC 模型),
模型, 获得未来 3 d 的精细化气温格点预报产品。 并 检 验 评 估 CNN-TC 模 型 与 ECMWF 模 式 、 SC‐
通过对比三组特征组合方案, 分别为加入地理变量 MOC在湖南地区预报效果。结论如下:
聚类特征、 加入未聚类地理变量以及不加入地理变 (1) 模式预报因子和地理变量的联合输入可