
Page 121 - 《高原气象》2025年第6期
P. 121
6 期 刘 杰等:基于决策树算法的青海省高原地区冰雹预报及关键特征因子分析 1529
图9 2017年7月9日泽库站(左)和茶卡站(右)的u500和t100的24 h变化折线图
Fig. 9 The 24-hour variation line charts of u500 and t100 at Zeku Station (left) and Chaka Station (right) on July 9, 2017
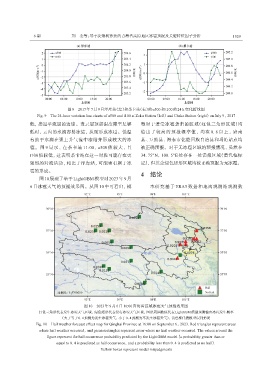
低, 接近平流层的边缘。当云层顶部温度降至足够 型对于遭受冰雹袭击的区域(红色三角形区域)均
低时, 云内的水滴容易冻结, 从而形成冰雹。低温 给出了较高的预报概率值, 均在 0. 8 以上, 贵南
有助于水滴在强上升气流中冻结并形成较大的冰 县、 互助县、 海东市化隆回族自治县和玛沁站点均
雹。图 9 显示, 在茶卡站 11:00, u500 值较大, 且 被正确预报。对于无冰雹区域的预报情况, 虽然在
t100 值较低, 这表明茶卡站在这一时段可能存在更 34. 75°N, 100. 5°E 处存在一处误报区域(黄色框标
强烈的对流活动, 相比于泽库站, 可能更有利于冰 记), 但其余绿色矩形区域均被正确预报为无冰雹。
雹的形成。
4 结论
图10展现了基于LightGBM模型对2023年9月
6 日冰雹天气的预报效果图。从图 10 中可看出, 模 本研究基于 ERA5 数据和地面观测站观测数
图10 2023年9月6日16:00青海省区域冰雹天气预报效果图
红色三角形代表发生冰雹天气区域, 绿色矩形代表没有冰雹天气区域, 图形周围数值代表LightGBM模型预测输出冰雹发生概率
(大于等于0. 4预测为发生冰雹天气, 小于0. 4预测为不发生冰雹天气), 黄色框代表模型误判情况
Fig. 10 Hail weather forecast effect map for Qinghai Province at 16:00 on September 6, 2023. Red triangles represent areas
where hail weather occurred, and green rectangles represent areas where no hail weather occurred. The values around the
figure represent the hail occurrence probability predicted by the LightGBM model (a probability greater than or
equal to 0. 4 is predicted as hail occurrence, and a probability less than 0. 4 is predicted as no hail).
Yellow boxes represent model misjudgments